
User`s guide
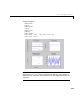


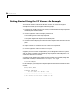

Table Of Contents
- Preface
- Quick Start
- LTI Models
- Introduction
- Creating LTI Models
- LTI Properties
- Model Conversion
- Time Delays
- Simulink Block for LTI Systems
- References
- Operations on LTI Models
- Arrays of LTI Models
- Model Analysis Tools
- The LTI Viewer
- Introduction
- Getting Started Using the LTI Viewer: An Example
- The LTI Viewer Menus
- The Right-Click Menus
- The LTI Viewer Tools Menu
- Simulink LTI Viewer
- Control Design Tools
- The Root Locus Design GUI
- Introduction
- A Servomechanism Example
- Controller Design Using the Root Locus Design GUI
- Additional Root Locus Design GUI Features
- References
- Design Case Studies
- Reliable Computations
- Reference
- Category Tables
- acker
- append
- augstate
- balreal
- bode
- c2d
- canon
- care
- chgunits
- connect
- covar
- ctrb
- ctrbf
- d2c
- d2d
- damp
- dare
- dcgain
- delay2z
- dlqr
- dlyap
- drmodel, drss
- dsort
- dss
- dssdata
- esort
- estim
- evalfr
- feedback
- filt
- frd
- frdata
- freqresp
- gensig
- get
- gram
- hasdelay
- impulse
- initial
- inv
- isct, isdt
- isempty
- isproper
- issiso
- kalman
- kalmd
- lft
- lqgreg
- lqr
- lqrd
- lqry
- lsim
- ltiview
- lyap
- margin
- minreal
- modred
- ndims
- ngrid
- nichols
- norm
- nyquist
- obsv
- obsvf
- ord2
- pade
- parallel
- place
- pole
- pzmap
- reg
- reshape
- rlocfind
- rlocus
- rltool
- rmodel, rss
- series
- set
- sgrid
- sigma
- size
- sminreal
- ss
- ss2ss
- ssbal
- ssdata
- stack
- step
- tf
- tfdata
- totaldelay
- zero
- zgrid
- zpk
- zpkdata
- Index
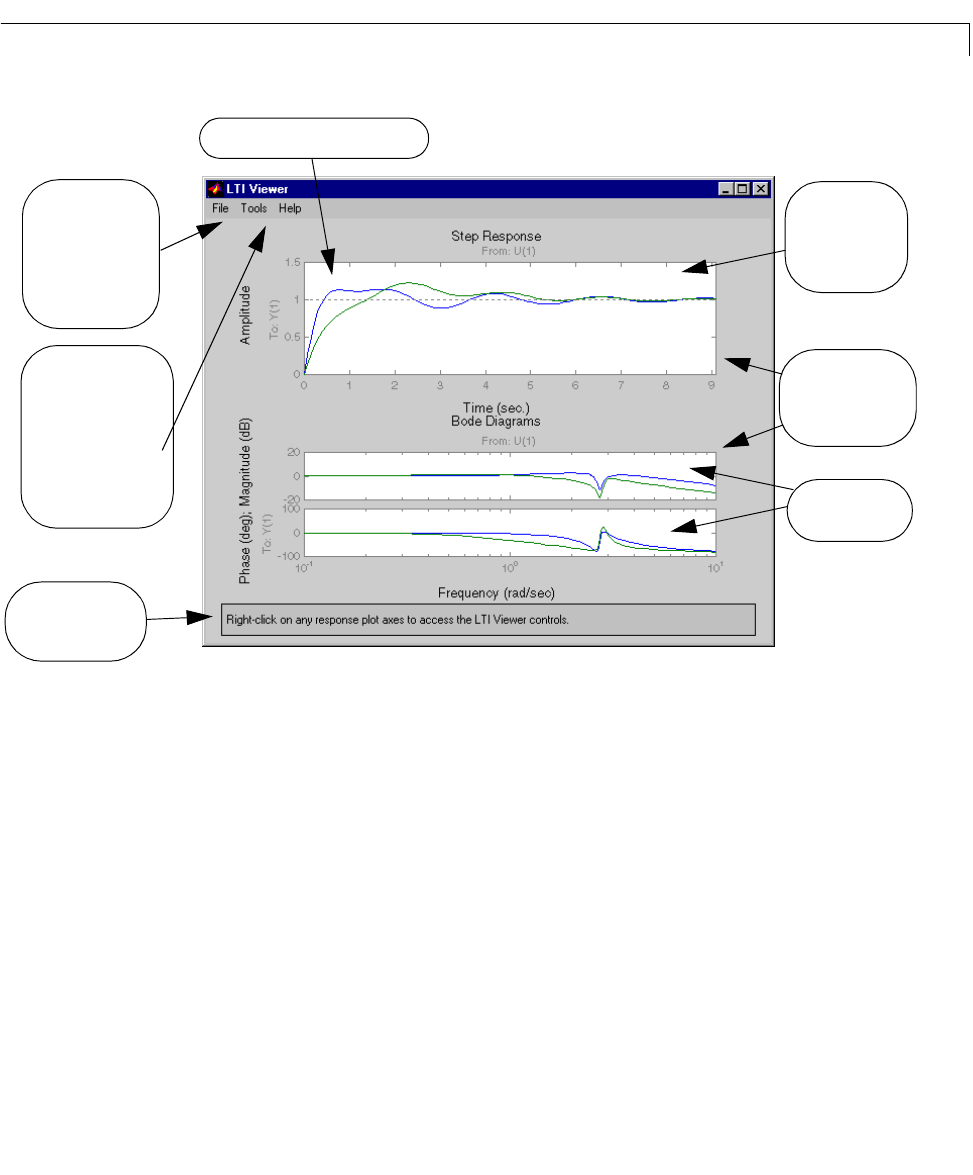
Getting Started Using the LTI Viewer: An Example
6-7
Right-Click Menus: Setting Response Characteristics
To a ccess the individual response plot controls, use the right-click menus
available from any of the plot regions displayed. These right-click menus vary,
depending onif theLTIVieweris displayingthe responseplots ofSISOmodels,
MIMO models, or LTI arrays. Some of the menu items are also plot type
dependent.
Forexample,supposeyouwantto mark thesettlingtimeonthestepresponses,
and t he peak magnitude response on the Bode plots. To do this:
Two response curves
are plotted on each
of the two plot
regions.
Right-click on
either plot region
to see the
response plot
menus.
The File menu has
several items,
including ones that
allow you to import
models and print
plots.
The
Tools menu items
allow you to
reconfigure the plot
arrangement and set
general plot and
linestyle preferences
for this open LTI
Viewer.
Plot region for the step response
Plot region for the
Bode plot
Status bar provides
useful information.