
User`s guide
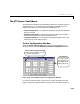
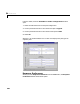
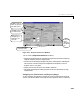
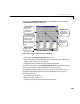
Table Of Contents
- Preface
- Quick Start
- LTI Models
- Introduction
- Creating LTI Models
- LTI Properties
- Model Conversion
- Time Delays
- Simulink Block for LTI Systems
- References
- Operations on LTI Models
- Arrays of LTI Models
- Model Analysis Tools
- The LTI Viewer
- Introduction
- Getting Started Using the LTI Viewer: An Example
- The LTI Viewer Menus
- The Right-Click Menus
- The LTI Viewer Tools Menu
- Simulink LTI Viewer
- Control Design Tools
- The Root Locus Design GUI
- Introduction
- A Servomechanism Example
- Controller Design Using the Root Locus Design GUI
- Additional Root Locus Design GUI Features
- References
- Design Case Studies
- Reliable Computations
- Reference
- Category Tables
- acker
- append
- augstate
- balreal
- bode
- c2d
- canon
- care
- chgunits
- connect
- covar
- ctrb
- ctrbf
- d2c
- d2d
- damp
- dare
- dcgain
- delay2z
- dlqr
- dlyap
- drmodel, drss
- dsort
- dss
- dssdata
- esort
- estim
- evalfr
- feedback
- filt
- frd
- frdata
- freqresp
- gensig
- get
- gram
- hasdelay
- impulse
- initial
- inv
- isct, isdt
- isempty
- isproper
- issiso
- kalman
- kalmd
- lft
- lqgreg
- lqr
- lqrd
- lqry
- lsim
- ltiview
- lyap
- margin
- minreal
- modred
- ndims
- ngrid
- nichols
- norm
- nyquist
- obsv
- obsvf
- ord2
- pade
- parallel
- place
- pole
- pzmap
- reg
- reshape
- rlocfind
- rlocus
- rltool
- rmodel, rss
- series
- set
- sgrid
- sigma
- size
- sminreal
- ss
- ss2ss
- ssbal
- ssdata
- stack
- step
- tf
- tfdata
- totaldelay
- zero
- zgrid
- zpk
- zpkdata
- Index
The LTI Viewer Tools Menu
6-41
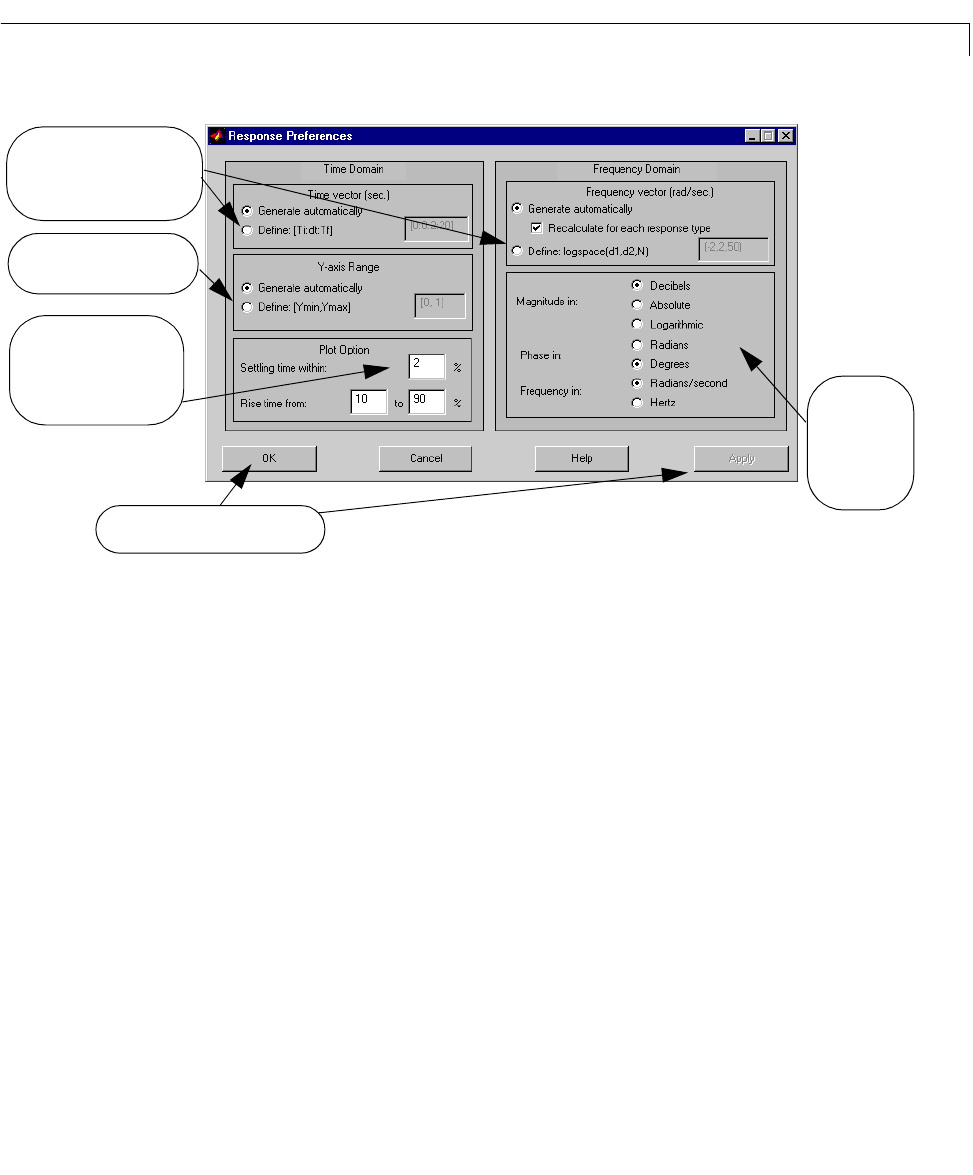
Figure 6-21: Response Preferences Window
You can use the Response Preferences window to:
• Specify the time duration for time domain response plots and the frequency
range for frequency domain response plots.
• Choose units for plotting the magnitude, phase,and frequency of Bode plots.
This choice of units also as signs the magnitude and frequency units for
singular value (
sigma)plots.
•Specify vertical axis limits for time domain responses.
• Set target percentages for settling time and rise time calculations on step
response plots.
Setting Response Time Durations and Frequency Ranges
To get a smoother time domain response curve over a specified time duration,
you can override the default time range and reset the time vector to a desired
Always press OK or Apply to
execute window options.
Select Define to define your
own time or frequency vectors
in the editable text boxes.
Select Define to define your
own vertical axis range.
Edit these text boxes to
customize the response
characteristics for step
response plots.
Use these radio
buttons to
change units on
Bode and sigma
plots.