
User`s guide
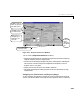
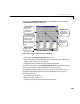
Table Of Contents
- Preface
- Quick Start
- LTI Models
- Introduction
- Creating LTI Models
- LTI Properties
- Model Conversion
- Time Delays
- Simulink Block for LTI Systems
- References
- Operations on LTI Models
- Arrays of LTI Models
- Model Analysis Tools
- The LTI Viewer
- Introduction
- Getting Started Using the LTI Viewer: An Example
- The LTI Viewer Menus
- The Right-Click Menus
- The LTI Viewer Tools Menu
- Simulink LTI Viewer
- Control Design Tools
- The Root Locus Design GUI
- Introduction
- A Servomechanism Example
- Controller Design Using the Root Locus Design GUI
- Additional Root Locus Design GUI Features
- References
- Design Case Studies
- Reliable Computations
- Reference
- Category Tables
- acker
- append
- augstate
- balreal
- bode
- c2d
- canon
- care
- chgunits
- connect
- covar
- ctrb
- ctrbf
- d2c
- d2d
- damp
- dare
- dcgain
- delay2z
- dlqr
- dlyap
- drmodel, drss
- dsort
- dss
- dssdata
- esort
- estim
- evalfr
- feedback
- filt
- frd
- frdata
- freqresp
- gensig
- get
- gram
- hasdelay
- impulse
- initial
- inv
- isct, isdt
- isempty
- isproper
- issiso
- kalman
- kalmd
- lft
- lqgreg
- lqr
- lqrd
- lqry
- lsim
- ltiview
- lyap
- margin
- minreal
- modred
- ndims
- ngrid
- nichols
- norm
- nyquist
- obsv
- obsvf
- ord2
- pade
- parallel
- place
- pole
- pzmap
- reg
- reshape
- rlocfind
- rlocus
- rltool
- rmodel, rss
- series
- set
- sgrid
- sigma
- size
- sminreal
- ss
- ss2ss
- ssbal
- ssdata
- stack
- step
- tf
- tfdata
- totaldelay
- zero
- zgrid
- zpk
- zpkdata
- Index
The LTI Viewer Tools Menu
6-45
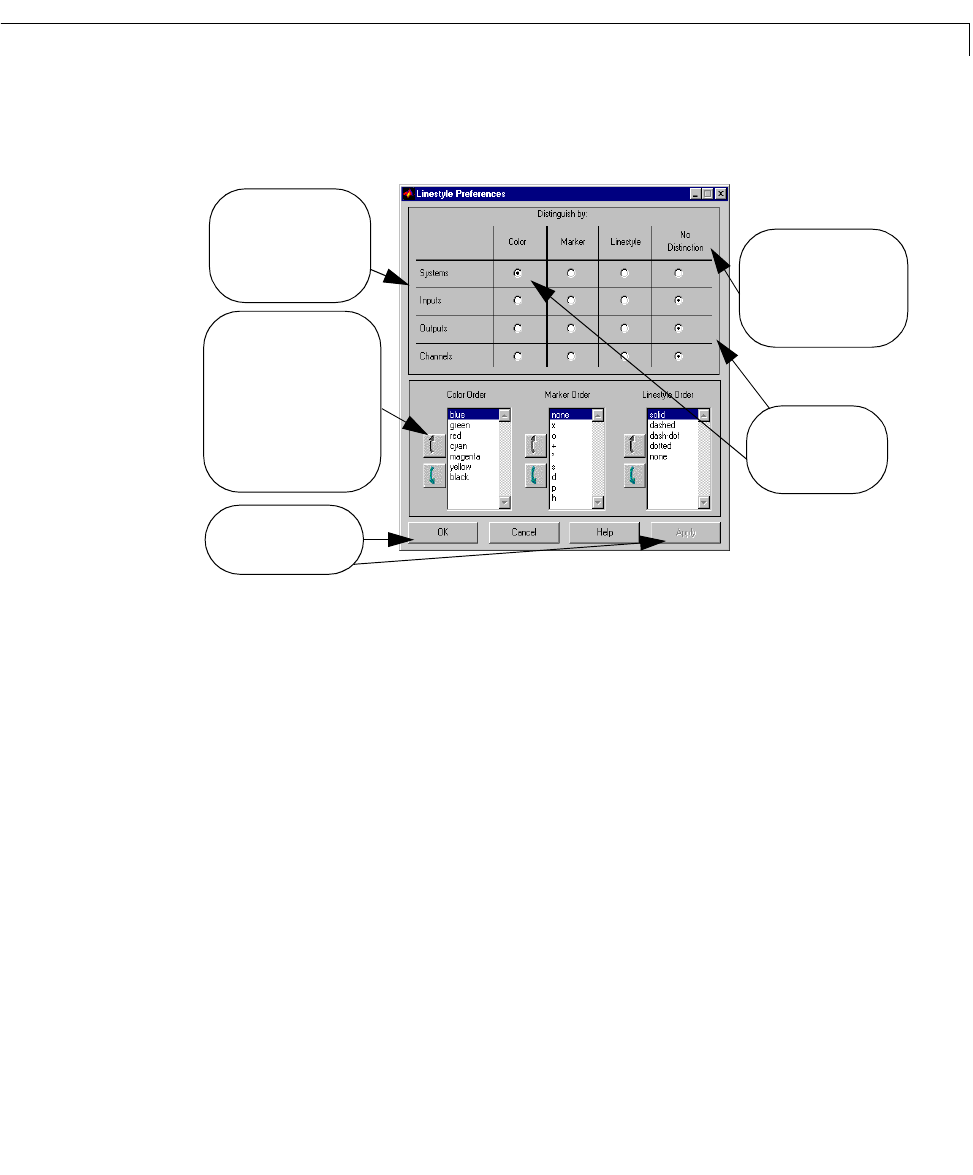
After selecting Linestyle Preferences from the Tools menu, t he following
Linestyle Preferences window opens.
Figure 6-23: The Linestyle Preferences Window
You can use the Lin estyle Preferences window to:
• Select the property used to distinguish the response curves for different LTI
models, inputs, outputs, or I/O channels.
• Change the order in which the line prop erties are app lied.
Thesettingsyou selectin the
Linestyle Preferences window overrideanyplot
styles you may have entered in the original
ltiview command.
To distinguish multiple response curves in each of the plot regions, you can
distinguish the plotted response curves using combina tions of any of the
following preferences:
• Colors (red, blue, green, etc.)
• Markers (circles, crosses, etc.)
• Linestyle, the type of curve drawn (solid, dashed, etc.)
Always press OK or
Apply to execute
window functions.
Distinguish multiple
response curves
according to any of these
four characteristics.
Distinguish multiple
response curves by
either of these three
line properties, or not
at all.
If you select a line property,
you can use the arrow buttons
next to one of the three
selected line property
listboxes to rearrange the
order of the entries in that
listbox.
The default linestyle
preferences are
selected.