
User`s guide


plot
4-122
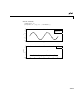
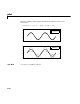
Plot 99% confidence and prediction bounds for the function and for a new
observation.
plot(fit1,'k-',x,y,'b.','predf','predo',0.99);
See Also errorbar, plot (built-in), subplot
−8 −6 −4 −2 0 2 4 6 8
−1.5
−1
−0.5
0
0.5
1
1.5
2
x
y
data
fitted curve
confidence bounds
−8 −6 −4 −2 0 2 4 6 8
−1.5
−1
−0.5
0
0.5
1
1.5
2
x
y
data
fitted curve
confidence bounds