
User`s guide

2 Importing, Viewing, and Preprocessing Data
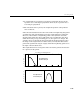
2-16
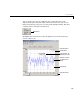
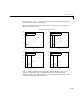
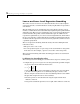
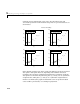
Using the lowess method with a span of five, the smoothed values and
associated regressions for the first four data points of a generated data set are
shown below.
Notice that the span does not change as the smoothing process progresses from
data point to data point. However, depending on the number of nearest
neighbors, the regression weight function might not be symmetric about the
data point to be smoothed. In particular, plots
(a) and (b) use an asymmetric
weight function, while plots
(c) and (d) use a symmetric weight function.
For the loess method, the graphs would look the same except the smoothed
value would be generated by a second-degree polynomial.
0 2 4 6 8
0
20
40
60
80
Lowess Smoothing
(a)
Data
Smoothed value
0 2 4 6 8
0
20
40
60
80
(b)
Data
Smoothed value
0 2 4 6 8
0
20
40
60
80
(c)
Data
Smoothed value
0 2 4 6 8
0
20
40
60
80
(d)
Data
Smoothed value