
User`s guide


Excluding and Sectioning Data
2-27
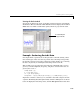
Exclude Individual Data Points
• Select data set — Select the data set from which data points will be marked
as excluded. You must select a data set to exclude individual data points.
•
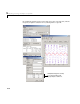
Exclude graphically — Open a GUI that allows you to exclude individual
data points graphically.
Individually excluded data points are marked by an “
x” in the GUI, and are
automatically identified in the
Check to exclude point table.
•
Check to exclude point — Select individual data points to exclude. You can
sort this table by clicking on any of the column headings.
Exclude Data Sections by Domain or Range
• Section — Specify a vertical window, a horizontal window, or a box of data
points to include. The excluded data lie outside these windows. You do not
need to select a data set to create an exclusion rule by sectioning.
-
Exclude X — Section the predictor data by specifying the domain outside
of which data is excluded.
-
Exclude Y — Section the response data by specifying the range outside of
which data is excluded.
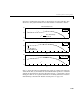
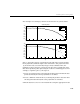
Marking Outliers
Outliers are defined as individual data points that you exclude from a fit
because they are inconsistent with the statistical nature of the bulk of the data,
and will adversely affect the fit results. Outliers are often readily identified by
a scatter plot of response data versus predictor data.
Marking outliers with the Curve Fitting Toolbox follows these rules:
• You must specify a data set before creating an exclusion rule.
In general, you should use the exclusion rule only with the specific data set
it was based on. However, the toolbox does not prevent you from using the
exclusion rule with another data set provided the size is the same.
• Using the Exclude GUI, you can exclude outliers either graphically or
numerically.
As described in “Parametric Fitting” on page 3-4, one of the basic assumptions
underlying curve fitting is that the data is statistical in nature and is described