
User`s guide

3 Working with Signals
3-82
•Select Compact display from the right-click menu to allow the scope to use
all the available space in the window.
•Select
CH 1 from the right-click menu, and then select Marker and “o” from
the submenus, to mark the data points on the channel 1 signal with circles.
•Select
CH 1 from the right-click menu, and then select Color and Blue from
the submenus, to code the channel 1 signal with the color blue.
•Select
CH 2 from the right-click menu, and then select Marker and
Diamond from the submenus, to mark the data points on the channel 2
signal with diamonds.
Displaying Signals in the Frequency-Domain
The Spectrum Scope block can display the frequency spectra of time-domain
input data. It differs from the Vector Scope by computing the FFT of inputs to
transform them to the frequency domain.
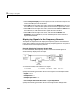
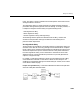
Example: Displaying Frequency-Domain Data
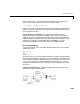
In the model below, the frequency content of two frame-based signals is
simultaneously displayed on the scope.
To create the model, first load the
mtlb signal.
load mtlb % Contains variables 'mtlb' and 'Fs'
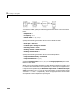
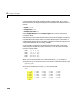
Specify the following parameter values in the Signal From Workspace block:
•
Signal = mtlb
•Sample time = 1
•Samples per frame = 16
•Form output after final data value = Cyclic Repetition
Specify the following parameter values in the Digital Filter Design block: