
User`s guide

Matrix Viewer
5-294
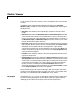
1 to N (number of columns), and the y-axis is numbered from 1 to M (number
of rows).
In addition to the standard MATLAB figure window menus (
File, Edit,
Window, Help), the Matrix Viewer window has an Axes menu containing the
following items:
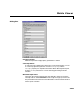
•
Refresh erases all data on the scope display, except for the most recent
image.
•
Autoscale recomputes the Minimum input and Maximum input parameter
values to best fit the range of values observed in a series of 10 consecutive
inputs. The numerical limits selected by the autoscale feature are shown in
the
Minimum input and Maximum input parameters, where you can make
further adjustments to them manually.
•
Axis zoom, when selected, causes the image to completely fill the containing
figure window. Menus and axis titles are not displayed. When
Axis zoom is
deselected, the axis labels and titles are displayed in a gray border
surrounding the scope axes, and the window’s menus (including
Axes) and
toolbar are visible. This option can also be set in the
Axis properties panel
of the parameter dialog box.
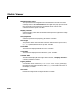
•
Colorbar, when selected, displays a bar with the specified colormap to the
right of the image axes.
•
Save Position automatically updates the Figure position parameter in the
Axis properties field to reflect the figure window’s current position and size
on the screen. To make the scope window open at a particular location on the
screen when the simulation runs, simply drag the window to the desired
location, resize it as needed, and select
Save Position. Note that the
parameter dialog box must be closed when you select
Save Position in order
for the
Figure position parameter to be updated.
Many of these options can also be accessed by right-clicking with the mouse
anywhere on the displayed image. The right-click menu is very helpful when
the scope is in zoomed mode and the
Axes menu is not visible.
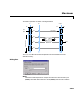
Examples See the demo dspstfft.mdl for an example of using the Matrix Viewer block
to create a moving spectrogram (time-frequency plot) of a speech signal by
updating just one column of the input matrix at each sample time.