
User`s guide

Matrix Viewer
5-296
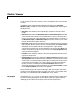
Maximum input value
The input value to be mapped to the color defined in the last row of the
colormap matrix. Select
Autoscale from the right-click pop-up menu to set
this parameter to the maximum value observed in a series of 10
consecutive matrix inputs. Tunable.
Display colorbar
Select to display a bar with the selected colormap to the right of the image
axes. Tunable.
Axis properties
Select to expose the axis property parameters. Tunable.
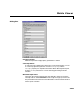
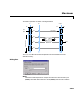
Axis origin
The position within the axes where the first element of the input matrix,
U(1,1), is plotted; bottom left or top left. Tunable.
X-axis title
The text to be displayed below the x-axis. Tunable.
Y-axis title
The text to be displayed to the left of the y-axis. Tunable.
Colorbar title
The text to be displayed to the right of the color bar, if
Display colorbar is
currently selected. Tunable.
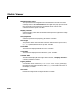
Figure position
A 4-element vector of the form
[left bottom width height] specifying
the position of the figure window, where
(0,0) is the lower-left corner of
the display. Tunable.
Axis zoom
Resizes the image to fill the figure window. Tunable.