
User`s guide


Vector Scope
5-512
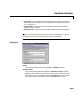
assume that it is time-domain or frequency-domain data. The dialog box
parameters give you complete freedom to plot the data in the most appropriate
manner.
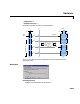
The scope updates the display for each new input frame. The number of
sequential frames displayed on the scope is specified by the
Time display span
parameter for time-domain signals, and the
Horizontal display span
parameter for user-defined signals. Setting either parameter to 1 plots the
current input frame’s data across the entire width of the scope. Setting these
display-span parameters to larger numbers allows you to see a broader section
of the signal by fitting more frames of data into the display region. A single
frame is the smallest unit that can be displayed, so neither parameter can be
less than 1.
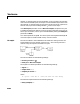
Scaling the Horizontal Axis for Time-Domain Signals
Scaling of the horizontal (time) axis for time-domain signals is automatic. The
range of the time axis is [0,S
∗T
fi
], where T
fi
is the input frame period, and S is
the
Time display span parameter. The spacing between time points is
T
fi
/(M-1).
➀➁➂➃
Time display span = 4