
Datasheet


Maxim Integrated
│
5
www.maximintegrated.com
Evaluates: MAX11300
MAX11300 Evaluation Kit
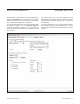
The Data tab (Figure 3) presents a tabular display of
all PIXI ports and temperature channels. Double-click
in the Configured As cells to jump directly to the Pin
Configuration tab (Figure 5) for the corresponding pin.
Each row represents one of the PIXI ports or one of the
temperature sensors. Some configurations enable DAC
Out or GPO Out controls, or provide ADC or GPI input
values. Pins configured for GPI input can be used as
interrupt sources by double-clicking in the Interrupt cell.
Select the Chart tab (Figure 4), then check Options
menu | Polling to show the analog inputs on a graph.
Figure 4 Chart Tab
Figure 4