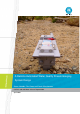
A Remote Automated Water Quality Stream Gauging System Design Aaron Hawdon, Rex Keen and Jamie Vleeshouwer CSIRO Land and Water Science Report 24/09 April 2009
CSIRO Land and Water Science Report series ISSN: 1834-6618 Copyright and Disclaimer © 2008 CSIRO To the extent permitted by law, all rights are reserved and no part of this publication covered by copyright may be reproduced or copied in any form or by any means except with the written permission of CSIRO. Important Disclaimer: CSIRO advises that the information contained in this publication comprises general statements based on scientific research.
ACKNOWLEDGEMENTS The authors would like to acknowledge funding from Meat and Livestock Australia, the Department of Defence and the NQ Dry Tropics. We would also like to thank Peter Fitch for the original concept and system programming; David Fanning for the original infrastructure design and installation techniques and Joseph Kemei for his help with installation and maintenance. Lastly, we appreciate the reviewers, Paul Daniel and David Blondeau-Patissier for their constructive comments on this manuscript.
EXECUTIVE SUMMARY The decline in the quality of water exported into the Great Barrier Reef (GBR) lagoon is of concern to government, natural resource managers, industry bodies and the community in general. Many of the rivers that flow into the GBR lagoon have seasonal flows driven by widespread rainfall events. Widespread flooding associated with large flows reduce or preclude access for the manual collection of water quality samples.
CONTENTS 1. Introduction ......................................................................................................... 1 2. System overview ................................................................................................. 2 2.1. Electronic Components............................................................................................. 2 2.1.1. 2.1.2. 2.1.3. 2.1.4. 2.1.5. 2.1.6. 2.1.7. 2.1.8. 2.1.9. 2.2. Infrastructure..................................................
7. Conclusion......................................................................................................... 21 8. Appendices ........................................................................................................ 22 Appendix 1 – Modem Setup.............................................................................................. 22 Appendix 2 – Design plans ...............................................................................................
1. INTRODUCTION The Burdekin River has the second largest catchment (~130,000 km2) that drains into the Great Barrier Reef World Heritage Area (GBRWHA). Approximately 90% of the catchment is used for cattle production. It delivers almost 4 million tonnes of fine sediment into the GBRWHA (Furnas 2003) annually. This is the largest contribution of any catchment draining into the GBRWHA and equates to about 26% percent of the total fine sediment exported into the GBRWHA.
2. SYSTEM OVERVIEW The three principal elements that comprise the standard stream gauging station are the electronics, infrastructure and the data-server. The electronic components are the measurement, control and communication devices located at the site of monitoring. Sensors and sampling hoses are installed in the stream channel. The system control and communication components are located on the stream bank above the high water mark.
probes can be customised to measure up to 3000NTU. In the standard gauging system design this probe is connected to a control port of the CR10x logger and assigned address 0. The NEP180 series is used in installations where turbidity readings greater than 3000NTU are expected. NEP180 probes provide an analogue (voltage) output that is measured using a differential channel on the logger. 2.1.4. Velocity Velocity is measured using a Unidata Starflow Ultrasonic Doppler Instrument.
2.1.8. Telemetry The telemetry system uses the mobile phone network where available. Where mobile phone coverage is not available, satellite based telemetry is employed. The CR10x data logger is capable of communication using circuit switched data at 9600 baud. A Campbell Scientific SC105 is required to interface between the modem and the data logger. The modems are powered through a relay that can be operated using a control port on the logger.
(a) (b) Figure 1 Examples of small platform design (a) at Thornton Creek and large platform (b) at Keelbottom Creek both located on the Department of Defence Townsville Field Training Area. Small platform The first design (Figure 1a) is for use on high banks where flooding does not pose a risk to equipment. The platform is constructed from 50 mm galvanized square hollow section (SHS) with an expanded mesh floor. It measures 1.2 m wide, 1.8 m long and 1.55 m high.
Ventilation is provided with two weather resistant vents located on either side of the enclosure, these vents have insect proof screen mounted on the inner surface to prevent insects entering the enclosure. Tabs on the bottom edges allow the enclosure to be anchored onto the platform. 2.2.3. Data logger enclosure The logger enclosure is one of the B&R EC range which can be purchased at many electrical supply stores. These enclosures protect internal components against the ingress of dust and water.
The standard mount is comprised of three components, a forward facing mount for the velocity sensor, a rearward facing mount for the turbidity sensor and sample hose, and the mount for the depth transducer. A bolt-on housing for a shurflo 9300 submersible pump is shown in Figure 5. 2.2.6. Rain gauge stand The rain gauge is generally mounted on a stand that is located away from the platform in an open area free from obstructions. The stand is constructed from a 1.
Figure 3 Example of a soft substrate installation. 3.1.2. Hard substrate A shallow, hard substrate, such as bedrock, provides the best condition for pier installation. The presence of bedrock allows direct bolting using chemset anchors, providing a strong positive attachment for the instrument pier. Two brackets are fixed using chemset anchors bolted directly into the substrate and then braced. The bracket for the main pier is the same design as a foot clamp for a large platform.
(a) (b) Figure 4 Starflow velocity probe mount (a) and turbidity probe mount (b). The turbidity sensor is encased in 25 mm NB steel pipe integrated into the mounting assembly. A stainless steel grub screw is situated on the underside of the mount which is tightened to hold the sensor in place. The depth sensor mount is directly bolted and glued into the top of the concrete footing or substrate. It is located to one side of and slightly behind the main pier.
Figure 5 B&R enclosure located to the rear of the pier to store excess cable. After the cables have passed into the box, they are run through 50 mm NB galvanised water pipe to the platform (Figure 6). Steel pipe is preferred as it provides excellent protection against the effect of large flows and floodwaters; it is impervious to trampling and gnawing by animals and provides good protection against fire. The pipe is shaped using a hydraulic pipe bender to conform to the surface of the ground.
Figure 6 Pipe installation at Keelbottom Creek (left) and Scrubby Creek (right) both located on the Department of Defence Townsville Field Training Area. The pipe is attached to piers located on the downstream side and offers good protection against fire. 3.4. Platform assembly The platform houses the instrument enclosure, auto sampler enclosure and solar panel array.
The studs can be tightened after the adhesive has cured. Loading time is approximately 12 hours at 25oC. Auto sampler enclosure Stainless steel bolts are threaded through the tabs on the base of the enclosure and passed through the expanded mesh on the platform. Backing plates are placed on the bolts below the mesh and the bolts are tightened to clamp the enclosure in place.
A length of light 15 mm steel pipe is attached to the stand to protect the cables in the event of fire. Steel pipe is also used to run the cables up the platform leg for fire resistance. The pipe terminates below ground level where it is connected to the cable conduit. The cables at the platform are protected using 16 mm corrugated conduit which terminates at a gland in the bottom of the electronics enclosure. 3.6.
Figure 7 Example of logger enclosure setup from Myuna station. Silica gel desiccant and camphor based insect deterrent is placed on the floor of the enclosure. 4. SYSTEM PROGRAMMING The two primary objectives of the system are: to collect stream data and to collect water samples. The program measures water depth every program cycle (60 seconds). If the depth is below a threshold, then data from all sensors, including rainfall are logged every hour.
Figure 8 Flow chart of monitoring station program. The program actually uses transitions between three primary states (Appendix 4 - Stream Gauge State Diagram) to determine program flow. These are Initialisation, Non-Event and Event.
4.1. Initialisation On initialisation, the program loads the variables used to control operation at that site. This state occurs if the system has lost power or when a new program is uploaded to the logger. Each site is assigned a unique site number based by region/project. For example all identification numbers for stations located in the Mingela region begin from 3000, those on Hervey’s Range from 5000. The four sites at Mingela therefore are assigned 3001, 3002, 3003 and 3004.
If a pump is installed at the site, the pump is turned on for a preset period of time prior to sample collection to purge the sample hose. This ensures that fresh water will be collected by the auto sampler. When a sample is required to be collected, the program, pulses the auto sampler, the sample number and bottle number counters are incremented, the bottles remaining counter is decremented and data is logged. The position of the current sampling window is tested and adjusted as required. 4.4.1.
5. DATA RETRIEVAL 5.1. Automatic downloading Data is automatically downloaded from a gauging site using a dedicated dial-up server running LoggerNet software. This software provides download scheduling, data collection and data storage from Campbell Scientific loggers. 5.2. Data processing 5.2.1. Importing data Downloaded data files are processed using Microsoft SQL Server 2000 DTS.
Figure 10 Example of a Data Report page.
6. SAMPLE RETRIEVAL 6.1. Collection When sample bottles are retrieved from a station, a pre-printed, waterproof label is attached to the bottle. This labelling system uses Avery L7060 heavy duty labels although any label that is waterproof and laser printable will suffice. The labels contain the site name, sample identification number and the year. When a sample bottle is removed from the auto sampler, the next label in the series is attached.
7. CONCLUSION All installations continue to provide the most detailed water quality data of any stream monitoring sites in the Burdekin catchment. The ability to collect water quality data and samples over entire hydrographs has facilitated improved estimations of contaminant loads exported from waterways and with a quantifiable level of uncertainty (Bartley et al 2007, Post et al 2006 and Brodie et al 2005).
8. APPENDICES Appendix 1 – Modem Setup Wavecom Fastrack GSM modem 1. Enter the settings AT+IPR=9600 E0 Q1 S0=2 2. Save the configuration AT&W ModMax 3G Data Modem 1. Set auto soft reset to a scheduled interval (1440 = Daily) AT$$RESET=1440 2. Check reset value AT$$RESET? 3. Set CSD Service Type AT+CBST= (speed, data circuit type, transfer type) AT+CBST=7,0,1 4. Turn Circuit 109 on for CSD Service AT&C1 5. Set Modem to Auto Answer after 2 seconds ATS0=2 6. Set Baud Rate AT+IPR=9600 7.
11.
Appendix 2 – Design plans A Remote Automated Water Quality Stream Gauging System Design 24
A Remote Automated Water Quality Stream Gauging System Design 25
A Remote Automated Water Quality Stream Gauging System Design 26
A Remote Automated Water Quality Stream Gauging System Design 27
A Remote Automated Water Quality Stream Gauging System Design 28
A Remote Automated Water Quality Stream Gauging System Design 29
A Remote Automated Water Quality Stream Gauging System Design 30
A Remote Automated Water Quality Stream Gauging System Design 31
A Remote Automated Water Quality Stream Gauging System Design 32
A Remote Automated Water Quality Stream Gauging System Design 33
A Remote Automated Water Quality Stream Gauging System Design 34
Appendix 3 - Wiring Diagram A Remote Automated Water Quality Stream Gauging System Design 35
Appendix 4 - Stream Gauge State Diagram A Remote Automated Water Quality Stream Gauging System Design 36
9. REFERENCES Reports Bartley, R., Hawdon, A. and Keen, R. (2007). Sediment and nutrient loads at the Myuna Gauge in the Bowen Catchment (2006/2007). CSIRO Client report to ACTFR and the Burdekin Dry Tropics Board August 2007. Brodie, J., Duncan, I., Bainbridge, Z., Post, D. and Furnas, M. (2005). Burdekin region Water Quality Monitoring January 2005 Event. Interim Report to the Burdekin Dry Tropics Board – July 2005. Fanning, D., Fitch, P. and Post, D. (2003).
Technical Documents CR10x manual http://www.campbellsci.com.au/documents/manuals/cr10x.pdf PS7000 specification sheet http://www.cleanairsystems.com.au/__data/page/11833/PS7000_Sensor.pdf McVan NEP390/395 http://www.mcvan.com/images/stories/acrobat/nep390.pdf McVan NEP180 http://www.mcvan.com/images/stories/acrobat/nep190.pdf Starflow Ultrasonic Doppler http://www.unidata.com.au/products/Starflow/6526/#specs ISCO 3700 Water sampler http://www.johnmorris.com.au/ssl/store/zcust_displayproduct.
A Remote Automated Water Quality Stream Gauging System Design 39