
Technical data

24 Brocade MLX Series and NetIron Family Documentation Updates
53-1002805-03
Aggregated TM VOQ statistics collection
1
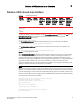
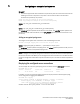
Displaying TM statistics from the multicast queue
Use the following command to display traffic manager statistics from the Multicast queue for
priority 1 on a module.
Brocade# show tm-voq-stat src_port eth 4/1 multicast 1
Priority = 0/1
EnQue Pkt Count 0
EnQue Bytes Count 0
DeQue Pkt Count 0
DeQue Bytes Count 0
Total Discard Pkt Count 0
Total Discard Bytes Count 0
Oldest Discard Pkt Count 0
Oldest Discard Bytes Count 0
WRED Dropped Pkt Count 0
WRED Dropped Bytes Count 0
Current Queue Depth 0
Maximum Queue Depth since Last read 0
Syntax: show tm-voq-stat src_port source-port multicast priority | all
Specification of a source-port is required.
You can optionally specify a priority to limit the display to a single priority or use the all parameter to
display all priorities.
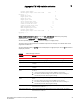
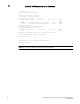
WRED Dropped Pkt Count A count of all packets entering ingress queues on this traffic manager but dropped
due to WRED.
WRED Dropped Bytes
Count
A count of all bytes entering ingress queues on this traffic manager but dropped due to
WRED.
Maximum Queue Depth
since Last read
The maximum queue depth since last access to read.
TABLE 8 Traffic Manager statistics (Continued)
This field... Displays...