
Technical data

40 Brocade MLX Series and NetIron Family Documentation Updates
53-1002805-03
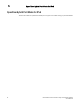
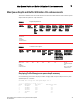
Max Queue Depth and Buffer Utilization CLI enhancements
1
6 532 0% 2/7
7 0 0% NA
--------- Ports 3/25 - 3/48 ---------
QType Max Depth Max Util Destination Port
0 0 0% NA
1 0 0% NA
2 0 0% NA
3 0 0% NA
4 0 0% NA
5 0 0% NA
6 0 0% NA
7 0 0% NA
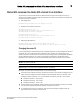
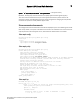
Syntax: <show | clear> tm-voq-stat max-queue-depth slot <slotnum>
You can clear the max queue depth report using the clear command.
Displaying Traffic Manager maximum buffer utilization
Use the following command to monitor Traffic Manager maximum buffer utilization.
Brocade# show tm buffer-pool-stats slot 3
--------- Ports 3/1 - 3/4 ---------
Maximum Buffer Size: 0 (0%)
Maximum Occupied Buffer Descriptors: 0 (0%)
--------- Ports 3/5 - 3/8 ---------
Maximum Buffer Size: 0 (0%)
Maximum Occupied Buffer Descriptors: 0 (0%)
Syntax: show tm buffer-pool-stats slot <slotnum>
You can optionally clear the buffer pool statistics report using the clear tm buffer-pool-stats
command.
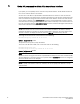
TABLE 13
Field Explanation
QType Queue priority
Max Depth Maximum queue depth of any queue with Qtype in bytes
Max Util Percentage of max queue util (max-queue-depth / max-queue-size)
Destination Port Destination port of queue that had highest max queue depth
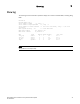
TABLE 14
Field Explanation
Maximum Buffer Size High watermark of buffer size in bytes (for both Gold and Bronze traffic) since last
read. Also shows percentage of buffer used out of max packet buffer. Clear on read.
Maximum Occupied
Buffer Descriptors
High watermark of descriptors (buffer pointers) used (for both Gold and Bronze
traffic) since last read. Also shows percentage of descriptors used out of total
descriptors. Clear on read.