
User guide


- 21 -
•
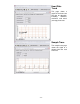
Heart Rate Trend – shows a graph of the heart rate over the test
period - dotted lines indicate a break in the signal. The times when the
Log Button was pressed are shown as lines over the graph
•
Sample Trace – shows a sample of what the ECG trace looked like
at 3 minutes after the start of the test
•
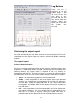
Log Button Records – there is a separate page for each of the
first nine times and the last time the log button was pressed
On the computer
Open the previously named results file as you would any document on the
computer. You can either read the results on screen or print off a paper copy.
The sections you will select are as follows:
Heading
This page is where you
enter the user name
and any confidential
comments
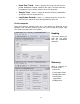
Summary
Gives a summary of
the ECG results:
• Heart rate
• Tachycardia events
• Bradycardia events
• Heart rhythm
irregularities
• Ectopic beats