
Operation Manual


MI 2092 Power Harmonics Analyser Section III Operation manual
29
n LAST IP lines: Display energy in last integration period (if data logging is active):
Active positive energy
Ep+ in kWh
Reactive positive capacitive energy
EQc+ in kvar
Reactive positive inductive energy
EQi+ in kvar
Active negative energy
Ep+ in kWh
Reactive negative capacitive energy
EQc+ in kvar
Reactive negative inductive energy
EQi+ in kvar
NOTE: At least one signal from Signal Sub-menu (fig. 10) and Periodics ON from
Configuration Sub-menu (fig. 9) must be selected.
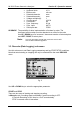
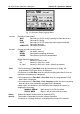
6. Spectrum (Harmonic Analysis)
This function displays the results of Fast Fourier Transformation (FFT) calculations,
both as values and in graphic mode.
Graphs are auto scaled in order to ensure maximum resolution.
The top line provides information on the selected input (U
1
, I
1
, U
2
, I
2
, U
3
, I
3
), its absolute
value and the synchronisation frequency.
The bottom line provides details of the selected harmonic component and its absolute
and percentage values. The equivalent bargraph is identified by a blinking cursor.
fig. 15: Harmonic Analysis
Use LEFT and RIGHT keys to select the required bargraph, and the SELECT key to
choose the required input signal (U
1
, I
1
, U
2
, I
2
, U
3
, I
3
).
7. Meter
This function displays the basic measured quantities (AC) in the 3j system. The display
format and legends (V, kV, A, kA, W, kW, MW, etc.) are automatically selected
appropriate to the measured values. The following quantities are displayed:
Phase rms voltage (U
1
, U
2
, U
3
).
Phase rms current (I
1
, I
2
, I
3
).
Per phase signed active ,apparent and reactive powers (±P, ±S, ±Q).
Power Factors with indication of direction (capacitive or inductive).