
Operation Manual


MI 2092 Power Harmonics Analyser Section V PC software
44
3. Direct link
The Direct Link facility allows direct on-line operation, with real-time values from the
voltage and current inputs displayed on the screen. Complex calculation can be carried
out and selected input signals waveforms can be saved, can be exported to an ASCII
file or to the Clipboard for use with third party analysis tools.
To open the connection to the instrument, click on the ‘ go!’ button.
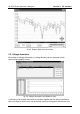
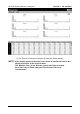
fig. 38: Direct Link oscilloscope screen
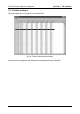
To read Energies from the instrument, click on the ‘Eng’ button. A small window
showing the current values of the energies is displayed.
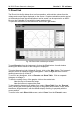
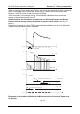
To look at Harmonics, both Voltage & Current, click on the ‘Mag’ button. The harmonic
analysis screen is displayed, with six histograms – three voltage and three current –
showing harmonics up to the 63
rd
.
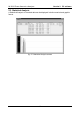
To zoom in any histogram, click on Execute and Show Table. Click on separate
histogram to enlarge it.
To alter the scaling of any of the graphs, click on the vertical axis:
Near the top to increase the range.
Near the bottom to expand the scale.
To also show the harmonics in tabular form, select ‘Show Table’ from the ‘Execute’
menu. Moving the mouse pointer along any of the graphs will activate a curser, which
identifies a single harmonic, with the tabular display scrolling in sympathy with the
curser position.
To return to the main Direct Link screen, select ‘Close’ from the ‘Execute’ menu.