
Owner manual


4 Introduction to the operation
746 VA Trace Analyzer / 747 VA Stand
4-20
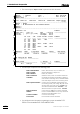
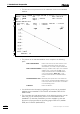
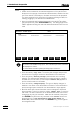
• First the full report Report Full is printed out with all results:
================== METROHM 746 VA TRACE ANALYZER (5.746.0101) ==================
Determ. : 03201614 User: Date: 1997-03-20
Modified : no Run : 1 Time: 16:14:53
Sample table: -
--------------------------------------------------------------------------------
Pos. Ident.1/S1 Ident.2/S2 Ident.3/S3 Method.call Sample size/S0
0.1 mL
--------------------------------------------------------------------------------
Method : TESTPb
Title : Pb determination in ion standard solution
Remark1 :
Remark2 :
--------------------------------------------------------------------------------
Substance : Pb Comments
Mass conc.: 1.032 g/L Mass : 103.2 ug ––––––––––––––––––
MC.dev. : 0.011 g/L (1.05%) Add.mass : 100 ug
Cal.dev. : - V0.sample: 100 uL
VR U/mV I/nA I.mean Std.dev. I.delta Comments
––– ––––– –––––– –––––– ––––––– ––––––– ––––––––––––––––––
00 -355 -195.9 -194.7 1.569
01 -355 -195.3
02 -355 -192.9
10 -356 -385.2 -385.5 0.4942 -190.8
11 -356 -386.1
12 -356 -385.3
20 -357 -568.1 -568.5 1.968 -182.9
21 -357 -566.7
22 -357 -570.6
Substance Techn. Y.reg/offset Slope Nonlin. Mean deviat.
––––––––– –––––––– –––––––––––– –––––––––– –––––––––– ––––––––––––
Pb std.add. -1.957e-07 -3.907e-05 2.137e-09
C# Workg.com.var Remark
–– ––––––––––––– ––––––––––––––––
Final results +/- Res.dev. % Comments
––––––––––––––––––––––––––––––––– ––––––––––––––––– ––––––––––––––––––
Pb = 1.032 g/L 0.011 1.05
• The full report comprises the following parts:
1 Data of determination Name, date and time, user, run number, etc.
2 Data of sample Sample identification, sample size
3 Data of method Name, title, remarks
4 Data of substance Substance name, mass concentration found and
evaluation its absolute and relative total deviation, substance
mass found in measuring vessel, standard addition
mass and sample volume in the measuring vessel
5 Data of peak evaluation Overview of the 9 individual measurements with
the following results: peak voltage U, peak current
I, mean value of the peak current I.mean with
associated standard deviation Std.dev. and
difference between the peak currents I.delta
6 Data for standard Current value Y.reg for the sample calculated
addition from the standard addition curve, slope and mean
deviation of standard addition curve
7 Common variables not used in this example
8 Final results Final result with formula calculation
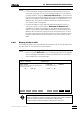
• You will find further information regarding the report in section 5.5.2
"RESULTS" and section 5.6.5 "DOCUMENTATION".
8
7
6
5
4
3
2
1