
Owner manual

6 Data processing and evaluation
746 VA Trace Analyzer / 747 VA Stand
6-30
m ≥ 4 Meas.dev. is calculated from σ
x,Mx,M
(see section 6.9.3).
m ≥ 2 If sufficient calibration points are available (see above),
Meas.dev. is estimated from Cal.dev. and the message
dev.estimated put out on the "RESULTS/Evaluations" page.
If this is not the case, Meas.dev. is calculated from σ
x,Mx,M
(see
section 6.9.3).
m = 1 If sufficient calibration points are available (see above),
Meas.dev. is estimated from Cal.dev. and the message
dev.estimated put out on the "RESULTS/Evaluations" page.
If this is not the case, Meas.dev. = 0 is set and the message
no meas.deviation put out.
The result determination with the aid of a calibration curve saves time compared
with standard additions, but is reliable only
– if the matrix of all samples and calibration solutions is identical or has
no influence on the measurement
– if all measurement parameters (capillary, temperature, etc.) remain un-
changed during measurements
– if the accuracy of the results obtained is checked regularly with the
standard addition method.
With regard to optimum accuracy and scatter, a number of rules must be observed
with calibration curves:
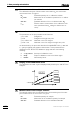
• Check linearity range
In development of the method, the linearity range of the calibration curve
should be checked for each substance by recording the curve over a wide
concentration range. Using the calibration curve shown on the "CURVES"
page, you can then determine the region in which the curve is linear and that
in which it is nonlinear.
• Working in the linear range
If you wish to perform determinations only in the linear range, to keep the
scatter as low as possible it is advisable to calibrate above all in the lower
and upper part of this range and select as many replications as possible.
• Working in the nonlinear range
If you wish to perform determinations in the nonlinear range, as many calibra-
tion solutions as possible with concentrations uniformly distributed over the
entire range should be recorded so that the nonlinear curve shape can be
determined exactly. To keep the scatter as low as possible, select as many
replications as possible.
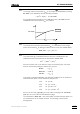
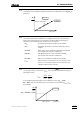
• Checking the offset
Before you deliberately force the calibration curve through the zero point, you
should first check curves with linear or nonlin to see whether the offset
Y.offset may be neglected. The size of the offset indicates a possible sys-
tematic error or blank value. To convert this error into the effective mass con-
centration in g/L, Y.offset must be divided by Slope.
• Determining the working range
The calibration curve is defined only for the range between the calibration
solutions with the lowest and highest mass concentrations. Extrapolations
outside this range are not allowed. Hence, enter the maximum possible