
Manual


7 Various functions
780/781 pH/Ion Meter, Manual
109
7.4 Limit monitoring
In all the direct measuring modes pH, T, U, Conc(direct) it is possible to
monitor the current measured value with respect to certain upper and
lower limits. In the modes pH and Conc(direct) the temperature can al-
so be monitored.
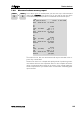
Under PARAMETERS/limits you can activate limits monitoring. De-
pending on the measuring mode you may be able to monitor the limits
of a secondary measured value in addition to the primary measured
value. You can define the upper and lower limits and the particular hys-
teresis. A detailed description of the parameter settings in each meas-
uring mode is given in Sections 6.2 to 6.5.
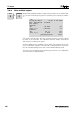
If a limit is exceeded then a beep will be heard and the following mes-
sage will appear on the display:
limit error
This message cannot be removed with
<QUIT>
. It will vanish automat-
ically as soon as the measured value again lies within the defined limits
when the hysteresis is taken into account.
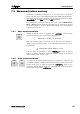
7.4.1 Uses
It is possible to use limit monitoring in the following ways:
1. Alarm
If a limit is exceeded then on the optionally available Remote Box a
specific line will be switched to "active". This means that a connected
signaler can be switched on in this way.
A detailed description of the connection lines at the 6.2148.010 Remote
Box can be found in Section 9.5.
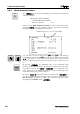
2. Control
If a limit is exceeded then on the optionally available Remote Box a
specific line will be switched to "active". A connected instrument (e.g.
Metrohm Dosimat Plus) can then be used to control the monitored pro-
cess (see Section 9.5
). You can also connect the 2.731.0010
Relay Box
to the Remote Box to control different instruments.
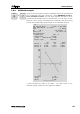
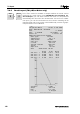
3. Documentation
If 'time' or 'plot' has been selected as a print criterion under CON-
FIG/print meas.value
then the displayed measured value will be
transferred via the RS232 interface to a printer either as a measuring
point report or as a plot. In the measuring point report each measured
value which lies outside the defined limits will be indicated by the mes-
sage
limit error. In the plot the limits are clearly shown as a dot-
ted line. An example of a printout can be found in Section 7.2.3.