
Manual

6.4 Potential measurement (U mode)
70
780/781 pH/Ion Meter, Manual
state: ON, OFF
u.limit -2200.0...1000.0...2200.0 mV
u.hyst. -2200.0...2.0...2200.0 mV
l.limit -2200.0...-1000.0...2200.0 mV
l.hyst. -2200.0...2.0...2200.0 mV
The exact way in which the limits function works is described in Sec-
tion 7.4 independent of the mode.
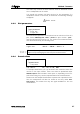
6.4.3 Plot parameters
PARAMETER U
:
├ plot parameters
: ├ left mar.
└ right mar.
The measured potential can be printed out as a function of time in a
plot. Under
CONFIG/print meas.value the print criterion 'plot'
must be selected (see Section 5.2). The scales of the measured values
axes are determined by the following limits.
Left mar. -2200.0...-1000.0...2200.0 mV
Right mar. -2200.0...1000.0...2200.0 mV
TIP !
The value for the right-hand limit of a plot must not necessarily be the
larger one. By exchanging the limits the plot can be mirrored.
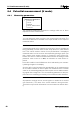
6.4.4 Preselections
PARAMETER U
:
└ preselections
└
req.ident
req.ident: id1, id1 & id2, OFF
For sample identification you can document each measured value with
two Ids in the report header. These can either be predefined under
CONFIG/report and included in each report or, depending on the Pre-
selection setting, they can be requested before each measurement.
Please note that sample identifications requested as a preselection be-
fore the measurement will also be stored as an entry under
CON-
FIG/report
. This means that they are again available for the next
measurement.