
Operating instructions


The “Statistics” application
72
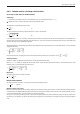
6.4.3 Sample printout with statistical values
The illustration opposite shows a sample printout with statistical values. The values printed
in the header, as single values and as the result, depend on your individual record set-
tings (section 6.3.5).
Only the statistical information included in the sample printout opposite is described
below. Notes on additional record information can be found in section 5.2.8:
“Plausibility”: Defined limit value for the plausibility of weight values.
“Nominal”: Defined nominal weight.
“+Tol”: Defined plus tolerance.
“-Tol”: Defined minus tolerance.
“1” ... “4”: Individual weight values in the weighing series. In this example,
the third sample is outside the upper weight tolerance (>T).
“n”: Number of samples weighed in.
“x”: Mean weight of all samples. The value is printed in the current
display unit. The resolution of the printed value is 10 times higher
than that of the measured value with the highest resolution in
the measurement series.
“s”: Standard deviation within the series. The value is printed in the
current display unit. The resolution of the printed value is 10
times higher than that of the measured value with the highest
resolution in the measurement series.
“s.rel”: Relative standard deviation within the series (as a percentage).
The value is always printed to 2 decimal places.
“Min”: Smallest recorded weight value in the current measurement
series. The number of decimal places and the unit correspond
to those that were visible when the measured value was trans-
ferred to the result display.
“Max”: Largest recorded weight value in the current measurement
series. The number of decimal places and the unit correspond
to those that were visible when the measured value was trans-
ferred to the result display.
“Diff”: Difference between the smallest and largest weight value in
the current measurement series. The value is printed in the
current display unit. The number of decimal places for the
printed value corresponds to that of the smallest or largest
weight value with the highest resolution.
“Sum”: Total weight of all saved individual weighings. The value is
printed in the current display unit. The number of decimal
places corresponds to that of the measured value with the
highest resolution in the measurement series.
Important information for interpreting printed results
The values “x” and “s” are calculated results, which are displayed at a higher resolution
than the single measured values. For smaller measurement series (fewer than approx.
10 measured values) and measurement series with small deviations, the significance of
the last decimal place cannot be guaranteed.
------ Statistics ------
26.Feb 2005 16:40
User Name User 2
Balance Type XP6002S
WeighBridge SNR:
1234567890
Terminal SNR: 1234567890
Balance ID Lab A/1
Balance is levelled
Plausibility 30 %
Nominal 24.20 g
+Tol 2.5 %
-Tol 2.5 %
1 24.21 g
2 24.67 g
3>T 24.91 g
4 24.18 g
n 4
x 24.493 g
s 0.357 g
s.rel 1.46 %
Min. 24.18 g
Max. 24.91 g
Diff 0.73 g
Sum 97.97 g
------------------------
Signature
........................
------------------------