
Specifications


Table Of Contents
- Content
- Welcome!
- Warranty
- 1. Getting Started
- 2. Software Configuration
- 3. Data Capturing
- 3.1. Open Files
- 3.2. Replay of Files
- 3.3. Editing Video Sequences
- 3.4. Saving Files
- 3.4.1. Setting the Recording Frame Rate
- 3.4.2. Setting the Recording Modes
- 3.4.3. Temporary Recording File
- 3.4.4. Saving Radiometric Video Sequences or AVI Files
- 3.4.5. Saving Image Data as Radiometric Snapshot or Text File
- 3.4.6. Saving Text File of the Temperature / Time Diagram
- 3.4.7. Location and Filename Templates of Triggered Recordings
- 3.4.8. Display of Snapshots in a Separate Window
- 3.4.9. Saving Images or Screenshots to Clipboard
- 4. Data Processing
- 5. Visual Camera (TIM200 only)
- Linescanner Mode
- 7. Further Information
thermoIMAGER TIM 14
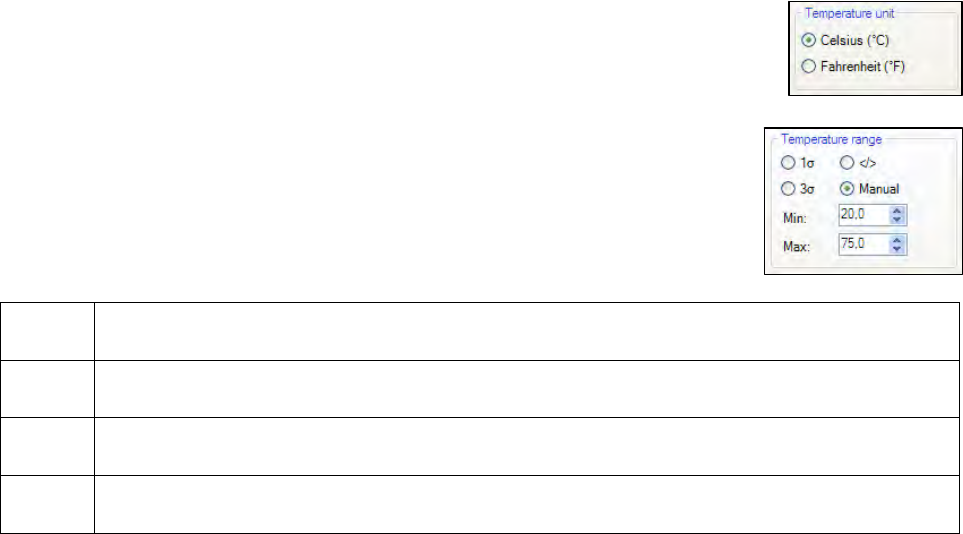
2.1.2. Temperature Unit
When setting the Temperature unit you can choose between Celsius (°C) and
Fahrenheit (°F).
2.1.3. Temperature Range of Reference Bar
Via Min. and Max. settings you can allocate colors to temperature values within the
reference bar .
These are the following options:
Manual The upper and the lower border can be determined individually.
</>
The software continuously
defines the upper and the lower border based on the hottest and
coldest pixel in the image.
1 σ
The mean value of all pixels in the image will be continuously
calculated. Based on the mean
value one standard deviation (1 sigma) sets the limits of reference bar.
3 σ
The mean value of all pixels in the image will be continuously
calculated. Based on the mean
value three standard deviations (3 sigma) set the limits of reference bar.