
Datasheet


MCP14E9/10/11
DS25005A-page 10 © 2011 Microchip Technology Inc.
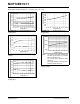
Note: Unless otherwise indicated, T
A
= +25°C with 4.5V ≤ V
DD
≤ 18V.
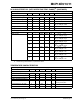
FIGURE 2-19: Input Threshold vs.
Temperature.
FIGURE 2-20: Input Threshold vs. Supply
Voltage.
FIGURE 2-21: Enable Threshold vs.
Temeprature.
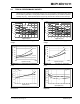
FIGURE 2-22: Enable Hysteresis vs.
Temperature.
FIGURE 2-23: Crossover Energy vs.
Supply Voltage.
1.0
1.1
1.2
1.3
1.4
1.5
1.6
1.7
1.8
1.9
2.0
-40 -25 -10 5 20 35 50 65 80 95 110 125
Temperature (°C)
Input Threshold (V)
V
HI
V
LO
V
DD
= 18V
1.0
1.1
1.2
1.3
1.4
1.5
1.6
1.7
1.8
4 6 8 10 12 14 16 18
Supply Voltage (V)
Input Threshold (V)
V
HI
V
LO
1.0
1.1
1.2
1.3
1.4
1.5
1.6
1.7
1.8
-40 -25 -10 5 20 35 50 65 80 95 110 125
Temperature (°C)
Enable Threshold (V)
V
EN_L
V
EN_H
0.20
0.25
0.30
0.35
0.40
0.45
0.50
0.55
0.60
-40 -25 -10 5 20 35 50 65 80 95 110 125
Temperature (°C)
Enable Hysteresis (V)
V
DD
= 12V
1.E-09
1.E-08
1.E-07
1.E-06
4 6 8 1012141618
Supply Voltage(V)
Crossover Energy (A*sec)
Note: The values in this graph represent the
loss seen by both drivers in a package
during a complete cycle.
For a single driver, divide the stated
value by 2.
For a single transition of a single driver,
divide the stated value by 4.