
Datasheet


© 2011 Microchip Technology Inc. DS25005A-page 7
MCP14E9/10/11
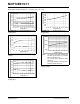
2.0 TYPICAL PERFORMANCE CURVES
Note: Unless otherwise indicated, T
A
= +25°C with 4.5V ≤ V
DD
≤ 18V.
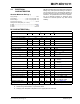
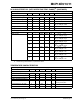
FIGURE 2-1: Rise Time vs. Supply
Voltage.
FIGURE 2-2: Rise Time vs. Capacitive
Load.
FIGURE 2-3: Rise and Fall Times vs.
Temperature.
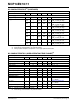
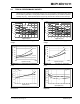
FIGURE 2-4: Fall Time vs. Supply
Voltage.
FIGURE 2-5: Fall Time vs. Capacitive
Load.
FIGURE 2-6: Propagation Delay vs. Input
Amplitude.
Note: The graphs and tables provided following this note are a statistical summary based on a limited number of
samples and are provided for informational purposes only. The performance characteristics listed herein
are not tested or guaranteed. In some graphs or tables, the data presented may be outside the specified
operating range (e.g., outside specified power supply range) and therefore outside the warranted range.
0
20
40
60
80
100
120
4 6 8 10 12 14 16 18
R
i
s
e
T
i
m
e
(
n
s
)
Supply Voltage (V)
6,800 pF
4,700 pF
3,300 pF
1,800 pF
1,000 pF
Rise Time (ns)
0
20
40
60
80
100
120
1000 10000
Capacitive Load (pF)
Rise Time (ns)
12V
18V
5V
10
15
20
25
30
35
40
-40 -25 -10 5 20 35 50 65 80 95 110 125
Temperature (°C)
Time (ns)
t
FALL
t
RISE
V
DD
= 18V
C
LOAD
= 1,800 pF
Fall Time (ns)
0
20
40
60
80
100
120
140
4 6 8 10 12 14 16 18
F
a
l
l
T
i
m
e
(
n
s
)
Supply Voltage (V)
6,800 pF
4,700 pF
3,300 pF
1,800 pF
1,000 pF
Fall Time (ns)
0
20
40
60
80
100
120
140
1000 10000
Capacitive Load (pF)
Fall Time (ns)
12V
18V
5V
35
40
45
50
55
60
65
456789101112
Input Amplitude (V)
Propagation Delay (ns)
t
D2
V
DD
= 12V
t
D1