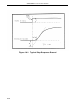
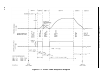
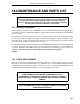
Note: The approximation of a process step response curve by a first order time lag plus dead-time
model is done by equating their values at 0.2835 and 0.6321 fraction of the total excursion.
Figure 17-2. Process Step Response Curve
53MC5000 Process Control Station
17-6