
User manual


11-6
EZ Match User Manual
Evaluation
Histogram
Note: Since histograms are performed in the imager, the results will be saved regardless
of whether the image was uploaded as a JPEG (.jpg) or a bitmap (.bmp).
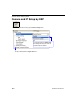
1. From the Evaluation window, click the Histogram button.
The current image is transferred into the histogram operation. This may take
a
mo
ment, since all the relevant pixels are being evaluated intensively.
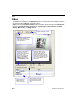
2. When the Histogram window opens, you may need to expand the window and/o
r
adjust
the scroll bars in order to bring the image into view.
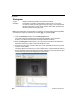
3. To generate a histogram, click and drag your cursor diagonally across the symbol
or
a
portion of the symbol.
The image will be surrounded by an “area of interest box”, a dashed blue
line with red
a
nchor points that can be selected and moved by placing a cursor inside the box, an
d
can
be resized by clicking and dragging the anchor points.
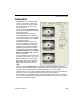
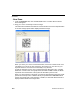
Usage: Useful in determining quality and contrast of symbols.
Definition: A histogram is a graphic representation of the numeric count of the
occurrence of each intensity (gray level) in an image. The horizontal axis
represents the values of gray levels, and the vertical axis represents the
number of pixels for each gray level.