
User manual

miniDSP Ltd, Hong Kong / www.minidsp.com / Features and speci fi cations subject to change without prior noti ce 29
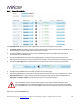
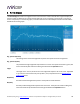
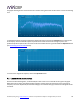
The graphs showing all nine measurements are useful for seeing how much variation there is across the listening
area:
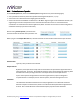
To display the impulse response instead of the magnitude response, click on the Impulse button at the top left
of the display. All nine individual impulse responses can be shown as well as the average respon se. The
predicted impulse responses after correction can be viewed after filters are generated with the Optimize button
(see Generating correction filters below).
To return to the magnitude response, click on the Spectrum button.
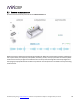
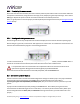
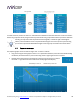
4.1 LINKING AND UNLINKING CHANNELS
Channels can be linked together, as indicated by the small “chain” icons on the tabs at the right of the graph.
When channels are linked, their graphs display together, and they share the same target curve and range of
frequency correction. By default, the front left and right, surround left and right, and rear left and right channels
are linked.