
User manual


Table Of Contents
- Important Information
- 1 Product Overview
- 2 Installation and Setup
- 3 Acoustic Measurement
- 4 Filter Design
- 5 Using the DDRC-88A audio processor
- 6 Optimizing gain structure
- 7 Additional Information
PRELIMINARY AND SUBJECT TO CHANGE
miniDSP Ltd, Hong Kong / www.minidsp.com / Features and specifications subject to change without prior notice 27
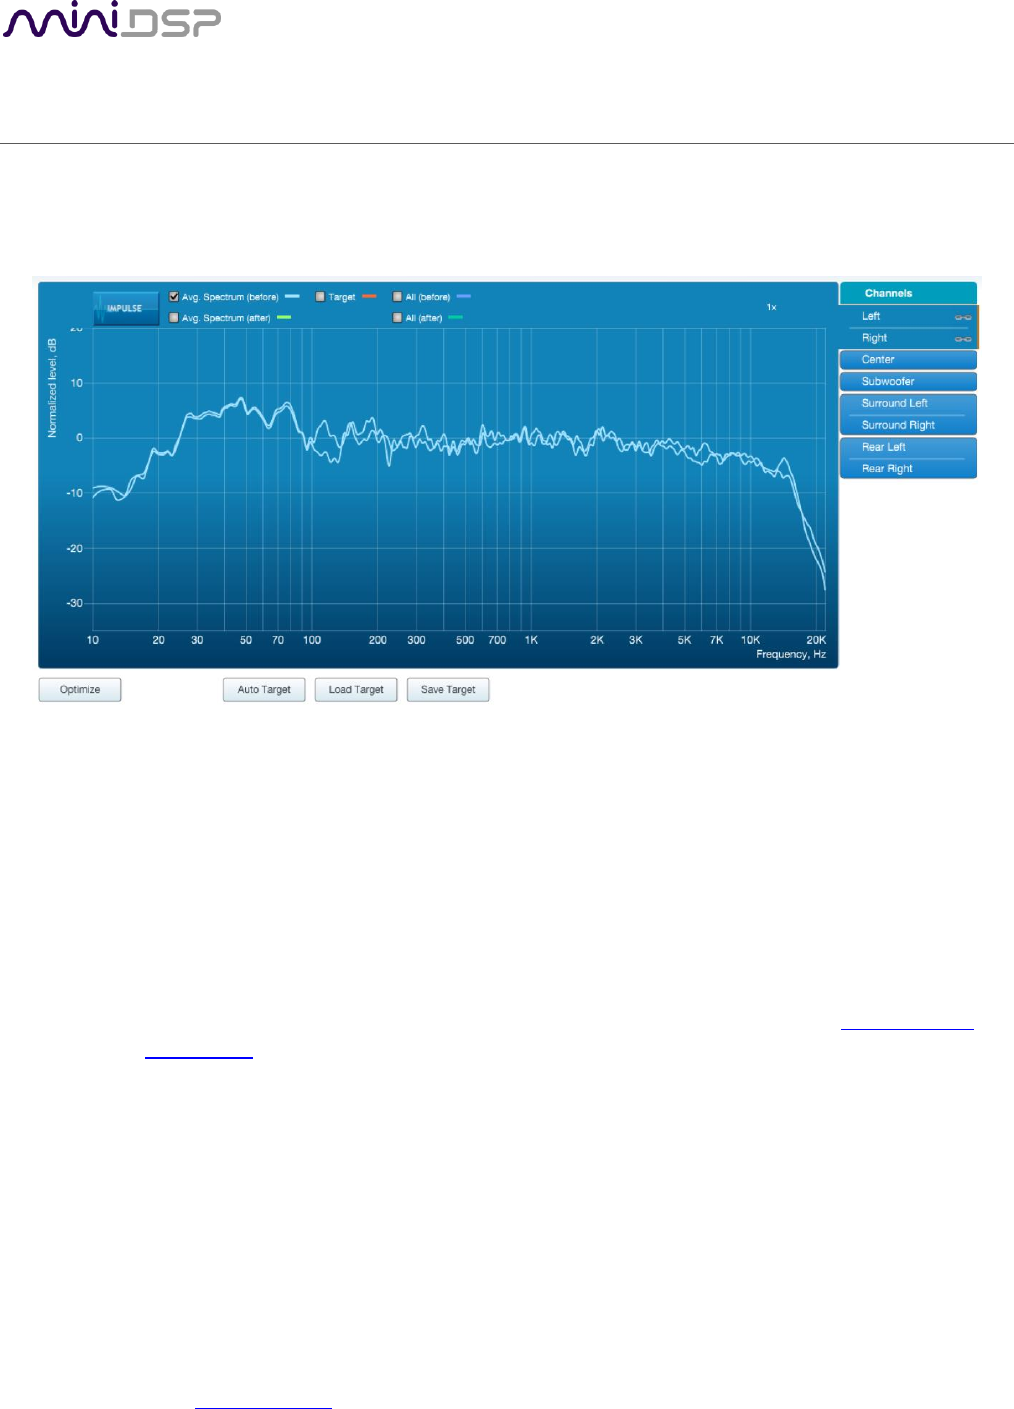
4 FILTER DESIGN
The Filter Design tab shows sets of graphs for the various 7.1 channels, selected using the tabs at the – click on
these to display the response graphs for other channels (center, subwoofer, and surrounds). For each set of
graphs, a number of variants can individually be turned on and off with the checkboxes above the graphs.
Avg. spectrum (before)
The average of the measured magnitude responses. These plots are shown in light blue.
Avg. spectrum (after)
The predicted average magnitude response after correction. These plots are shown in green, and
can only be viewed after filters have been generated with the Optimize button.
Target
The target curve – that is, the desired in-room magnitude response. This curve is user-adjustable
so you can fine-tune it to best suit your speakers, room, and preferences. See Designing your
target curve below.
All (before)
All of the measured magnitude responses. These plots are shown dark blue.
All (after)
The predicted magnitude responses after correction. These plots are shown in dark green, and
can only be viewed after filters have been generated with the Optimize button.