
User manual


Table Of Contents
- Important Information
- 1 Product Overview
- 2 Installation and Setup
- 3 Acoustic Measurement
- 4 Filter Design
- 5 Using the DDRC-88A audio processor
- 6 Optimizing gain structure
- 7 Additional Information
PRELIMINARY AND SUBJECT TO CHANGE
miniDSP Ltd, Hong Kong / www.minidsp.com / Features and specifications subject to change without prior notice 28
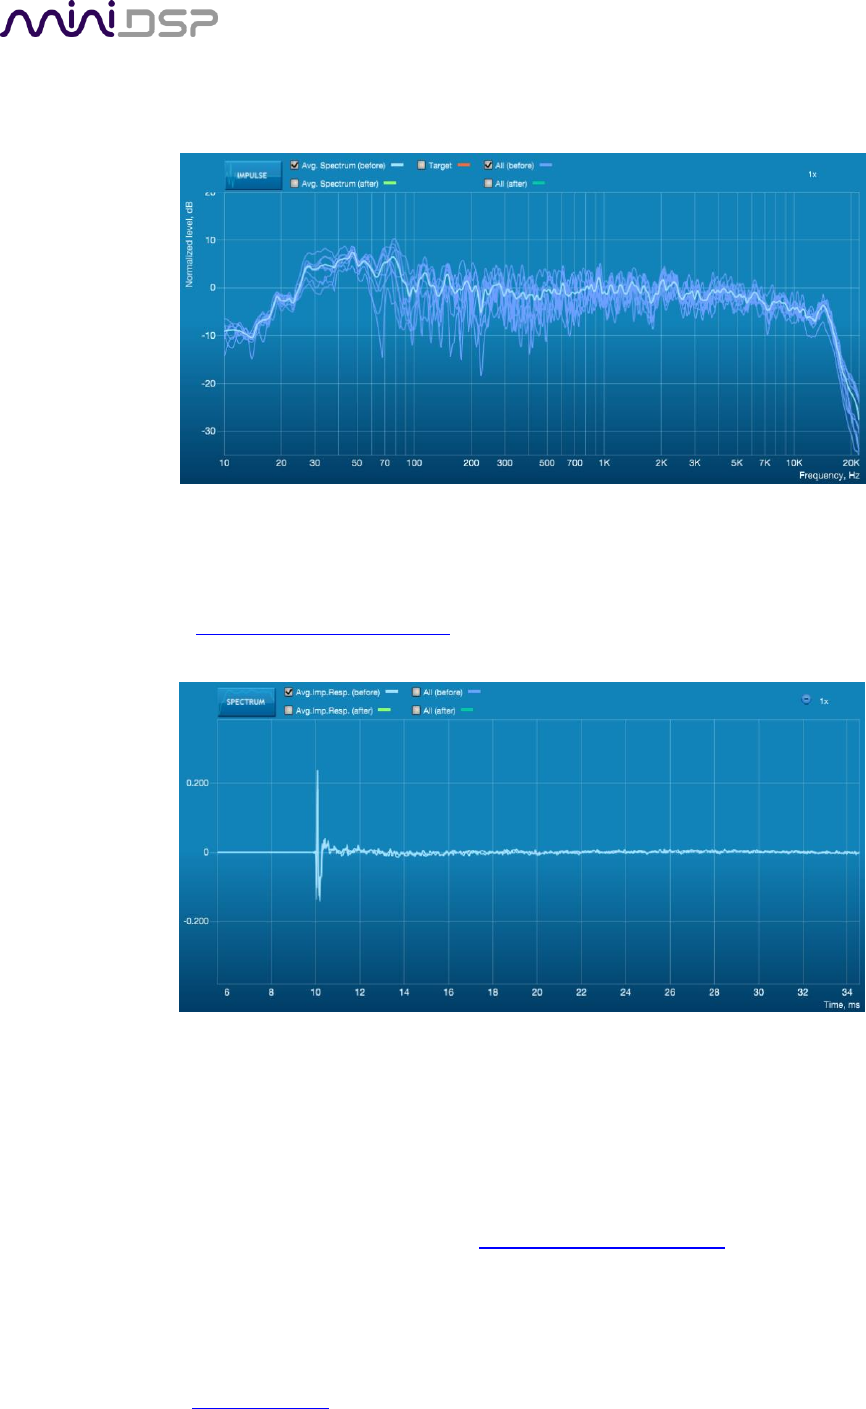
The graphs showing all nine measurements are useful for seeing how much variation there is across the listening
area:
To display the impulse response instead of the magnitude response, click on the Impulse button at the top left
of the display. As with the magnitude response, the average measurement can be shown as well as all nine
measurements. The predicted responses after correction can be viewed after filters are generated with the
Optimize button (see Generating correction filters below).
To return to the magnitude response, click on the Spectrum button.
4.1 WORKING WITH GRAPHS
Initially, the left and right front channels are shown. Some channels are linked together, as indicated by the
small “chain” icons on the tabs at the right of the graph. When channels are linked, their graphs display
together, and they share the same target curve – see Designing your target curve below. By default, the front
left and right, surround left and right, and rear left and right channels are linked.