
Operating instructions

GUIDE TO INSTALLATION AND OPERATION
24 | IRD-3802
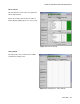
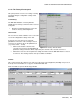
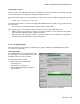
Pie Chart tab
This tab displays the incoming service in the form of
a pie chart, with color-coded segments representing
the various elements in the service.
• This representation illustrates the bandwidth
distribution within the service.
The table below the chart shows all of the elements,
identifying each by name, PID and bandwidth.
Click on a name in the table, and the corresponding
slice of the pie will slide out from the chart
Mouse-over a slice and the associated Program
Name will be shown on the chart, as shown in
Figure 3.16.
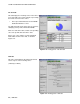
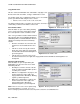
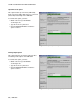
PSIP tab
This tab is an information-only tab that documents
various aspects of the incoming service
(Valid only for ATSC)
Figure 3.16 Probing panel – Pie Chart tab
Figure 3.17 Probing panel – PSIP tab