MITSUBISHI Building Air Conditioning Control System Maintenance Tools for MN converter & G-50A - Advanced - Operating Manual Contents Page 1 Foreword 1.1 1.2 1.3 1.4 Introduction of Maintenance Tools Required Operating Environment Installation Starting and Ending the Application 1 4 5 9 2 Terms for Each Section 2.1 Design of Screen 2.2 Operating Method 22 22 3 On-Line Monitor Operation Method 3.1 3.2 3.3 3.4 3.5 3.6 3.7 3.8 3.9 3.10 3.
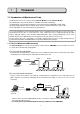
1 Foreword 1.1 Introduction of Maintenance Tools The Maintenance Tools are comprised of the On-Line Monitor and the Off-Line Monitor. The following two connection methods are available in the Online Monitoring. (1) Monitoring by connecting the maintenance tool to MN converter (CMS-MNF) via RS-232C. (2) Monitoring through the central controller (G-50) by connecting the maintenance tool to LAN. A brief explanation of each of their function is provided here.
1.1.2 On-Line Monitor(via G-50) The On-Line Monitor is connected to the unit by the central controller(G-50A) and can monitor such areas as system data, unit data and operating data. (1) In case for local connection By directly connecting the PC installed with Maintenance Tools and G-50A through LAN, various monitoring/setting can be performed from the Maintenance Tools.
1.1.3 Off-Line Monitor The Off-Line Monitor can display, print information obtained by the On-Line Monitor. In the case of connection monitoring utilizing G-50, the operation monitor data collected by G-50A will be transmitted to remote mail servers periodically if the [Operation monitor - mail communication mode] of online mode is adapted. Using this function allows to collect and monitor the operation monitor data without continually connecting the maintenance tool.
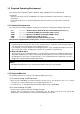
1.2 Required Operating Environment This manual refers to Windows® 2000 as Windows 2000, and Windows® XP as Windows XP. Trademarks MS, Microsoft, Microsoft logo, and Windows are registered trademarks and trade names of Microsoft Corporation. Each company may use as registered trademarks and trade names the product names used in this manual. 1.2.1 Hardware Requirements The computer must be IBM compatible on DOS/V and capable of satisfying the following requirements. - OS ....................
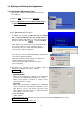
1.3 Installation There are two Maintenance Tool setup methods: Caution Please refer to also 1.3.4 RE: Method 1) New setup.(See Section 1.3.1) Change of computer name on PC. Method 2) Upgrading with existing setup.(See Section 1.3.2) 1.3.1 Setting Up the Maintenance Tools (New setup) To set up Maintenance Tools, follow the 3 steps below. : After finishing Step 1, PC restarts automatically. Step 1) Setting up of MSDE (Restarting PC is essential before going to Step 2.
Notice During database setting, the process may be observed as stopped for a while. However, it is still under operation internally. Wait for some time until "Press any key to continue - - - -" appears without doing anything. *Do not stop the set up procedure by pressing at the upper right of the screen. Step 3) Setting up the Maintenance Tools Set up the application of this Maintenance Tools. Please read the guide shown on the screen carefully to proceed the setting up.
1.3.2 Running Maintenance Tool Upgrade The following describes how to upgrade the Maintenance Tool. Step 1) Ending the Maintenance Tool Step 2) Uninstalling the Maintenance Tool :Restart your computer after completing the STEP 2. Step 3) Upgrade the Database Step 4) Upgrade the Maintenance Tool :Restart your computer after completing the STEP 4. Request •For setting up, be sure to practice 4 steps in order. Otherwise, Maintenance Tools will not operate normally.
1.3.3 Uninstalling the Maintenance Tools The method to uninstall the application of the [Maintenance Tools] once installed is given below. (1) Uninstalling the Maintenance Tools 1) Confirm the ending of Maintenance Tools. Confirm that Maintenance Tools program has been ended. If not, end the program. *For the ending method, refer to Chapter 1.4.5. 2) Start [Add/Remove Programs]. Click on [Add/Remove Programs] from [Control panel] to start.
1.4 Starting and Ending the Application 1.4.1 Starting the Maintenance Tool (1) Connect the computer and G-50A(MN Converter) and air conditioner. (2) Click on “Start”, and then click on ”Programs”. (3) Click on “Maintenance Tool for Windows2000 & XP” in the “Maintenance Tool” folder. (4) The Title Screen will soon appear. In addition, the message of [This unit can be changed into °F and pounds/inch2.
1.4.2 Starting the On-Line Monitor(MN Converter connection) 1.4.2.1 In case for local connection This will be used when online monitoring is adapted to air conditioning system by connecting the maintenance tool and MN Converter locally. The maintenance tool, MN Converter and air conditioning system should be connected beforehand. (1) Clicking "MN CONVERTER" on the selection screen of Monitor mode selects "Local connection" simultaneously.
(3) Initial setting of modem For the modem to be installed at the local side (MN Converter side), initial setting should be applied before connecting remotely. To apply the initial setting of the modem, click on the remote setting screen. The Connection Modem Initial Setting Screen will appear. A modem that is already initialized does not have to be re-initialized. The explanation of the operation only is described here.
(4) Initiating the remote connection To initiate the remote connection, click on the remote setting screen. The Customer Selection Screen will appear. This screen connects to the on-site remote modem. (a) When the addressee has already been registered, select the customer name to be connected in "Select customer name box" and then click to initiate connection. In the case of initial connection or to change to a new addressee, click Then the Customer Information Registration Screen will appear. .
1.4.3 Starting the On-Line Monitor(G-50 connection) * To use the maintenance tool via G-50 (Network), license registration for the G-50 to be used is necessary. Purchasing the license No. for each G-50 to be used, conduct the license registration through the Web browser (http://[IP address of the G-50A]/ administrator.html). After selecting "Maintenance tool" of the optional function on the Web Browser Screen displayed, enter the purchased license No..
1.4.3.2 In case for remote connection (Dialup) In the case when on line monitoring is applied to local air conditioning system (with G-50 installed) from the maintenance tool in the remote place via public telephone circuit. * When utilizing Remote connection (Dialup),please prepare MODEM and DIAL-UP ROUTER (of a type allowing data communication by receiving external telephone transmission) for the connection with the public circuit in addition to the components used by Local connection (LAN).
1.4.3.3 In case for remote connection (E-mail) In the case when on line monitoring is applied to local air conditioning system (with G-50 installed) from the maintenance tool in the remote place via mail server. All communication to G-50 is converted in E-mail in this case. Notice •To use the E-mail connection mode, the version of G-50 should be above 2.60.
(b) Address book The mail address of G-50A for each project can be registered. As shown in the sample examples, register the name and mail address of G-50A after preparing the [Customer name] folder. [Entering order] 1) Preparing the Customer folder Pressing displays the input screen of customer name, and then enter the name. The setting can also be made from the file menu or the sub-menu displayed by right-clicking.
1.4.4 Starting the Off-Line Monitor When offline analysis is adapted to the data collected under ONLINE MODE. (1) Clicking "Offline Analyze" on the selection screen of Monitor mode. Last click " ." 1.4.5 Using the Wide area access mode Under the "Wide area access mode," the access method for remote connection can be registered to the database of each customer enabling easy online connection with the air conditioning system of the customer desired to be accessed.
1.4.5.1 Online Connection (1) Clicking “Online Connection (Wide area access mode)”on the section screen of Monitor mode. Last click " ." (2) The customer registration screen will be displayed. Register customer information in the order of [1] -> [2] -> [3] hierarchically. [1] Area name [2] Customer name [3] Air conditioning system name & connection method (a) Creating the [Area name] folder 1) When [Wide Area] is being focussed, the sub-menu will be displayed by right-clicking. 2) Select [Create Area …].
(c) Setting the [Air conditioning system name] 1) Under the state when the [Customer name folder] desired to be set on the air conditioning system is focussed, the sub-menu will be displayed by right-clicking the air conditioning system list at the right screen. 2) Selecting [Create ...] displays [Setting screen of air conditioning system]. [Setting screen of air conditioning system] 1) Set the system name. 2) Select the method to connect with the system.
(d) Other setting You may select the mail address of maintenance tool PC itself and the Com port to be used. * To use the E-mail mode, mail setting is essentially required. [Mail setting of maintenance tool PC] 1) POP server (Receiving) POP server address Set the IP address of the receiving mail server(POP3) of Maintenance Tool or domain name. POP account Set the POP account (user ID) for mail receiving. - POP password Set the user password for mail receiving.
1.4.6 Ending the Maintenance Tool 1.4.6.1 Ending the On-Line Monitor (1) Open the Main Screen. (2) Click on [File] on the menu bar. (3) Click on [Return] in the sub-menu. (4) The message “Are you sure you want to finish maintenance tool?” will appear. Click on . The On-Line Monitor will end and the Windows screen will appear. *At ending of Maintenance Tools, the telephone circuit will automatically be disconnected. * Clicking returns to the [selection screen of Monitor mode]. 1.4.6.
2 Terms for Each Section 2.1 Design of Screen The design of the screen is shown below. Title Bar Menu Bar Function Display / Operating Section - Title Bar Displays the title of the screen. - Menu Bar Displays the functions that can be performed using the current screen. Click on an item and a sub-menu or message screen will appear, as shown in the illustration. If a sub-menu appears, further function selections can be made. (Example of what the screen looks like when option is clicked.
3 On-Line Monitor Operating Method 3.
3.2 Function Chart Connecting Information ----------------------- [Refer to 3.6] This allows monitoring of the indoor units connected to the outdoor unit and of the interlock units and the operation group SC connected to indoor units. Operation Monitor ------------------------------- [Refer to 3.7] This allows monitoring of the operating condition of the unit and operating data. The operation data obtained will be shown in the form of a graph.
3.3.2 Automatic Searching (1) Click on and the Automatic Address Searching Screen will appear. - The time required to complete the automatic search will depend on the PC. - The address currently being searched for is displayed as [Address]. Up to 250 addresses can be searched for. - Click on to end automatic search. The Main Screen will appear. (2) When automatic search has ended, the Main Screen will appear. Returning to the Main Screen enables the [Function Buttons]. 3.3.
3.4 Main Screen The operations in 3.3 Address Search Method have made information about the units known. The [Unit Attributes] are displayed on top of the address buttons. The Function Buttons are now enabled at this time. (1) Click on an address [Button] displaying attributes and information about that unit will be displayed in the [Unit Information Display Columns]. (2) The menu bar will display [File], [Option] ,[Print] and [Help].
*Note "Stop mail communication" is a function to stop the operation monitor mail transmission of G-50 under [mail communication mode] set in Chapter 3.7. It has no relation with (2)-2 E-mail connection mode of 1.1.2 On-line Monitor (via G-50). 3.5 Function Selection Operations (1) First, click on the desired [Function Selection Button]. (2) Next, click on the Unit to Operate. (3) The screen will move to the various operation screens.
3.6.2(2) (4)Momentarily, the Connecting Information Screen will appear. (5)Click on Information Screen. to end the Connecting (6)The message ”Finish the Connecting Information” will appear. Click on to end or click on to continue. Click on and the Main Screen appears. (5) 3.6.2 Screen Functions and Operation (1) Double-click on the interlock unit and operation group SC (remote controller), the Operation System SC Connecting Information Screen (in case operation group SC) will appear as a pop-up menu.
3.7 Operation Monitor * Items Performed Here - Monitors the operating condition and operating data of the current units every minute. This information can be displayed and saved. * When an excessively large number of the objective unit for monitoring exists, the monitoring interval may exceed 1 minute (70s, 80s, ---). * The capacity to store the data obtained by the maintenance tool counts for 2G-bite maximum.
When [Mail communication Mode] is selected, the setting items of mail communication will be displayed. - From: Mail Address Set the mail address of the G-50A in the [From: Mail Address] field. When sending mail via an ISP, set the mail address allocated by the ISP. When the mail server resides on the LAN, obtain the mail address from the LAN administrator. * When sending mail via an ISP, a user contract with the ISP is required.
(8) Click on to end the Operating Status Monitor Screen. The message “Finish the operation status monitor” will appear. Click on to end or click on to not end. Clicking displays the screen to save data. Change the data name as required and save it. You may enter your comment also. Clicking does not allow the data to be saved. Returning to the main screen. 3.7.2 Screen Functions and Operations - The operating condition and operating data are displayed every minute. - The [Current Time] is displayed.
* About LM ADAPTER Operation Monitor Item Performed Here Operation status of LM ADAPTER, current values of network variable and configration property,setting status of switch or the like. [Refer to 3.7 Operation Monitor] 1 Screen Transfer Operation To move to the screen monitoring LM ADAPTER operation, select LM ADAPTER from the main screen. (LM ADAPTER is expressed by ) When LM ADAPTER is selected,you may not monitor other units.
3 Introduction to the screen Display Contents Set status of function selector switch 0:OFF setting 1:ON setting Set status of extension function selector switch 0:OFF setting 1:ON setting Set status of M-NET address switch on LM ADAPTER SWU1:The units digit SWU2:The tens digit Internal processing status of LM ADAPTER FLAG:Control flag status ERROR:Error flag status [M]:M-NET communication processing flag [LON]:LonWorks communic
Display Contents Unit address (Unit digit) Binding information on operation status output 0:No binding 1:Binding Unit address(Tens digit) Unit address (Unit digit) Connection status of air conditioner(indoor unit) 0:Not connected 1:Connected Unit address(Tens digit) Unit address (Tens digit) Latest value of network variables [Rcv] Received value of operation command input [Snd] Output value of operation status St :
3.7.3 Trend graph Clicking at 3.7.2 (2) [GRAPH] displays Trend Graph Screen. (1) Procedure for graphing (a)Click [Option] on the menu bar. (b)The sub-menu of "Graph detail setting" and "Other setting" will be displayed. Click "Graph detail setting" to set each item of the graph. *Note Without setting of each item on "Graph detail setting," no graph can be displayed. (The graph detail setting is explained in (c) and other setting is in (d).) 6) (c) Graph Detail Setting Screen will be displayed.
2) Clicking returns to Trend Graph Screen displaying the horizontal grid line in the number being set to the graph. (e) Starting the graph Clicking initiates monitoring to graph the data for each one minute. The sampling time to allow graphing by online system is limited to 500 minutes maximum. If 500 minutes are exceeded, the data of old time is eliminated by the excess time. (3) (2) Screen function and operation [Graph number] - The current monitor data is displayed on [Lower column].
3.8 Malfunction Log * Items Performed Here - The malfunction log of the most recent 10 cases (except operation group SC) 3.8.1 Screen Transfer Operation (1) Click on from the function selection buttons on the Main Screen. (2) Click on the units to be monitored (except operation group SC). (3) The message “Monitoring. Please wait for a moment.” will appear. (4) Momentarily, the Malfunction Log Screen will appear.
(5) Click on to end the Malfuncion Log Screen. The message “Close the malfunction log display? ” will be displayed. Click on to end or click on to not end. is clicked, the Main Screen is returned. Note: When G-50A is connected to the system, the malfunction log of OC is eliminated. Please check the malfunction log in G-50 to check the malfunction log of OC. 3.8.2 Screen Functions and Operations (1) Click on and the Address Change Screen appear. Click on to change the address.
3.9 Optional Setting * Items Performed Here - Self-Diagnosis Monitoring : The self-diagnosis function (LED for service monitor) to be performed with Dip-SW on the circuit board of the outdoor unit can be monitored. - Operation Control : Controlling of unit operation can be performed in the same manner as a remote controller. - Sending Command : Allows to monitor the response for any M-NET command transmitted to the unit.
3.9.3 Sending Command (1) Click on and the Sending Command Screen will appear. (2) Input M-NET command desired to transmit by clicking on the button. Direct input from the keyboard is also possible. (3) After inputting command, click on . Response command is displayed on [Answer] column. (4) Click on to end the Sending Command Screen and return to the Optional Setting Screen. * NOTE Use this function after obtaining the knowledge of M-NET command. 3.9.
3.9.5 Date / Time Setting (1) Click on . The Date / Time Setting Screen opens and the present time of PC is displayed. * When the unit which does not correspond to a setup of time is chosen, the message of "This function is not available" is displayed, and it cannot set up. (2) A click of sets the time currently displayed to a unit. * The time to set up can also be changed on a screen. Cursor is united with a change point and a numerical value is inputted.
3.10 Operation Control * Items Performed Here - ON / OFF of the unit, the operation mode and setting the temperature can be performed in the same manner as a remote controller. 3.10.1 Screen Transfer Operation (1) Click on from the function selection buttons on the Main Screen. (2) Click on the unit to be controled. (3) The Operation Control Screen will be appear. This display shows the current conditions. 3.10.2 Screen Functions and Operation (Indoor unit, LOSSNAY unit) (1) Set each desired [Item].
3.10.3 Screen Functions and Operation(BC Controller) (1) Click on the button corresponding to the valve number you want to change. “0” represents “close” and “1” represents “open”. To change the valve setting, perform “Fix Release” --> “Fix” (2) After setting, click on (3) Click on . to check the current conditions. (4) Change the LEV opening with LEV opening. Click on contents. .
3.11 Free contact of indoor unit * Items Performed Here - When utilizing the [Indoor unit free contact mode] which uses the external input/output of Free Plan indoor unit (Building-Multi) together with G-50 and TG 2000, the contact action of the indoor unit can be tested with this function. 3.11.
(2) Automatic monitoring To automatically monitor the contact status of indoor units of No.1 ~ 50 repeatedly, select the [Auto monitor] mode. a) Click the [Auto monitor] button on the mode selection section. The contact status of indoor units of No.1 ~ 50 will automatically be monitored, and this operation will be repeated. The display for [Attribute], [Indoor unit contact mode], [Input contact (monitor)] and [Output contact (monitor/operation)] are identical to that in the manual monitoring.
4 Off-Line Monitor Operating Method 4.1 Off-Line Monitor Screen Transfer Title Screen Operation Monitor (Operation status monitor screen) (Operation monitor Data list screen) (Trend graph screen) Monitoring of Pre-error Data System Information (System info.
4.2 Function Chart 4.2.1 Operation Monitor Off-Line Analizing --------------------- [Refer to 4.3.1] Monitors and prints about unit data saved in On-Line “3.7 Operation Monitor”. Graph --------------------- [Refer to 4.3.2] The operation data obtained can be graphed for display. Check Mail ------------------------------- [Refer to 4.3.3] Extracts the operation monitoring data being mail-transferred by the remote monitor mode from the mail server. 4.2.
4.3 Operation Monitor * Items Performed Here - Monitors and prints about the System Information and the Operating Data of units saved using the on-line monitor. 4.3.1 Off-Line Analyzing (1) Click on to display the data list screen of Operation Monitor. (2) Click on [Monitor Data] desired to be monitored. (3) Click on . Notice: This covers the operation with the menu of the right-clicking of the mouse. (Refer to 4.6.6 Right-clicking menu.
- Click on [Help] and “Explanation of Terminology” and “Operation Method” sub-menus can be selected. [Refer to 3.6 Connecting Information 3.6.2 (2) ”Menu Bar”] (c) Click on [Return] on the menu bar to end the Operation Status Monitor Screen. The screen returns to the data list screen of Operation Monitor. 4.3.2 Graph (1) Click on to display the data list screen of Operation Monitor. (2) Click on [Monitor Data] desired to be monitored. (3) Click on .
- Clicking "Sampling setting ---" displays Sampling Setting Screen. Set the sampling time (interval) by moving [Scroll bar] or input through the keyboard. For the sampling interval, set the time interval of the abscissas axis with 1 ~10 minutes. For the horizontal grid line, refer to [3.7.3 (1) Procedure for graphing]. (b) Screen function and operation 1) Clicking [Graph number] makes the graph line bold.
4.3.3 Check mail *Mail Server Setting In order to provide mail checking to the operation data mail-messaged from G-50 by utilizing Mail communication mode under online mode, the setting is required relating to the connection of the objective mail server. (a) Clicking on the sub-menu “Mail server setting” of “Setting” on the menu bar displays Mail server setting screen. (b) For lan connection, click on “LAN,” set the items relating to mail servers, and click on .
4.4 System Information 4.4.1 Off-Line Analyzing (1) Click on to display the data list screen of System Information. (2) Click on [Monitor Data] desired to monitor. (3) Click on . - The System Information Screen of Off-Line displays all connection information memorized by the connected G-50. Notice: This covers the operation with the menu of the right-clicking of the mouse. (Refer to 4.6.6 Right-clicking menu.
4.5 Monitoring of Pre-error Data 4.5.1 Off-Line Analyzing (1) Click on Pre-error. to display the data list screen of (2) Click on [Monitor Data] desired to monitor. (3) Click on . Notice: This covers the operation with the menu of the right-clicking of the mouse. (Refer to 4.6.6 Right-clicking menu.) (5) (4) On the Pre-error Data screen, the operation status data immediately before generating error will be displayed in a unit of minute.
4.6 Function common for each screen (Filing operation) * Clicking the button of "Monitor Data", "Monitor Date", "Last Updated" and "Others" at the upper column allows to sort the displayed data. * The right-clicking operation of the mouse covers the operation of each file also. For detail, refer to the item 4.6.5 Right-click menu. 4.6.1 Delete Data (1) Clicking either , or to display Data list screen containing the file desired to edit. (2) Click on [Monitor Data] desired to delete. (3) Click on .
4.6.4 Text Convert (1) Clicking to display Data list screen containing the file desired to edit. (Text conversion can also be adapted to the Pre-error data. For the converting method, refer to 4.5.1(5).) (2) Click on [Monitor Data] desired to convert into text format. (3) Click on . The screen to confirm the selected monitor data. Clicking on provides text conversion processing and then a file name will be displayed. [Refer to 5.
4.6.6 Right-clicking menu - Right-clicking menu Clicking the right button of the mouse on [Monitor data] displays the pop-up menu as shown on the right screen. The items that can be set are same as that of the function button on the screen listing each data. (Some function is unable to operate partially.) Use them in accordance with your applications.
4.7 Offline Analyze on Wide area access mode The function of the offline mode is mostly equals that of the normal mode, however, the following function is provided additionally. 1) Display of monitored name objective for data collection. - The [AREA name], [Customer name] and [Air conditioning system name] are shown for each data obtained. - Setting the cursor to the data provides the pop-up display of the [AREA name], [Customer name] and [Air conditioning system name] of the data.
5 File Names 5.1 System Information Data The data saved in Section "3.4 Main Screen (2)" is stored in c:¥ProgramFiles¥mnttool32¥DATA - The following is an explanation of the file name SI_20040315_181026.MTDX Extension Monitor Time*1 Default (Changeable to any desired name.) Fixed (SI) *The data obtained before Ver4.04 is represented by S_***_***_***.MTDX. 5.2 Operating Status Monitor Data The data saved in Section "3.
6 How to change setting of Firewall How to Change Setting of Firewall for Windows XP 1. Introduction When connecting Maintenance Tool through G-50A, normal communication may not be performed if Firewall, the security function of Windows XP, has wholly been validated. (* In E-Mail mode and MN converter connection, it is not related) Therefore, the setting of Firewall should partially be changed following the procedure indicated in Chapter 3 How to change the setting of Firewall. 2.
II) (7) The [Local Area Connection Properties] screen will be displayed. (8) Select the [Advanced] tab. (9) Confirm that the checking column of [Internet Connection Firewall] has been affixed with a check mark. (10) Click the [Settings - - -] button. (11) The [Advanced Settings] screen will be displayed. (12) Click the checking column of [Internet Mail Server [SMTP]] within the [Service] tab to affix a check mark. (13) Click the [OK] button to close the [Advanced Settings] screen.
(11) [Advanced Settings] will be displayed. (12) Click the checking column of [Internet Mail Server [SMTP]] within the [Service] tab to affix a check mark. (13) Click the [OK] button to close the [Advanced Settings] screen. Now the setting of Firewall has completed. Caution: Close all screens and start Maintenance Tool. For security protection while connecting with Internet and the like, it is recommended to restore the settings of Firewall to the original one after terminating Maintenance Tool.
On the [Windows Security Alert] screen, if [Keep Blocking] or [Ask Me Later] has been selected, the settings of Firewall should be changed manually. The method of change is given below. (1) Select [Control Panel] from the Start menu. (2) The [Control Panel] screen will be displayed. (3) Click [Network and Internet Connections]. (4) Click [Network Connections]. (5) The [Network Connections] screen will be displayed. (6) Right-click on the characters of [Local Area Connection] to display the sub menu.
(11) The [Windows Firewall] screen will be displayed. Confirm that Firewall is being set to [On [recommended]]. Do not affix a check mark to [Don't allow exceptions]. (12) Click the [Exceptions] tab. (13) Click the checking column of [MntTool32(Maintenance Tool)] to affix a check mark. ∗ When Maintenance Tool is not displayed on the program list, click the [Add Program - - -] to add Maintenance Tool. (a) Clicking the [Add program - - -] button displays the screen to add a program.
7 Troubleshooting? Trouble When Installing or Starting Trouble Cause Repair Cannot install. Cannot start application. Install CD-ROM not properly positioned. Insufficient memory. OS is not an English version. The message of ”Can’t Connect to G50” is displayed at on-line starting. The IP address of G-50A or PC is incorrect. LAN cable is not connected. The message of ”Maintenance Tool can’t The S/W version of G-50A is older than Ver2.40. connect to old version G50! Use G-50 upper version2.
A[**]appears in the unit address button for Interference caused an non-existing unit a unit that does not exist. to appear. Wait a moment and then click on the address button for the same unit again. The[**] display will disappear. A[??]appears in the address button. There is a unit that is not compatible with Refer to the explanation on terminology in the maintenance tools. help. If there is no explanation, the unit is not a compatible type. Address searching takes 3 minutes or more per set.
large!! Please, delete old monitor data!!" is insufficient. displayed during collecting data. Data becomes a red display and the "-" Since data cannot receive normally. display. - There is too much number of a monitor. - Data transforms itself by a noise. unnecessary data. - Reduce the number of a monitor. - Cope with noise generating origin. * Also when returning from a graph screen to an operation screen, it may become a red display and the "-" display, but it is normal.
Specific troubles induced by E-mail connection mode Trouble Cause Repair The message of ” Not connectable to mail The initial information is not being set to server.” or “Not connectable to G-50.” Is G-50. (The mail address of Maintenance Tool is displayed. not being registered previously.) The mail address normally obtained is not being set. The version of G-50 is not exceeding 2.60. The setting of the mail server address is not correct.
A message of " The file name is incorrect. It contains characters unable to be fetched in (such as [ “or”] and the like). --- " is displayed. Data cannot be imported. data obtained by Ver.4.** has no compatibility with that obtained by Ver.3.**. Please delete such special characters in the file name. Off-Line Monitor Trouble(2) Trouble Printing is not normally carried out for graph etc.