
Technical data

Simulating with Performance Analyzer
9-84 ModelSim EE/SE Tutorial
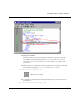
Notice that the overhead of running the Performance Analyzer is very small (your
results may differ from the results shown here), even with over 5000 samples of
the simulation run acquired.
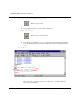
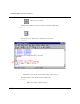
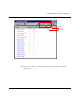
11 Display the Hierarchical Profile output.
view_profile
(MENU: View > Other > Hierarchical Profile)
Note that two lines – retrieve.vhd:35 and store.vhd:43 – are taking the majority of
the simulation time.
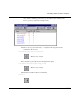
You can use the $PrefProfile(hierCutoff) Tcl control variable to filter out
everything below a certain percentage. hierCutoff is the minimum percent usage
that will be listed in the Hierarchical Profile display. The default value is 1%. Any
usage less than 1% will not be displayed.
You can also filter the display with the Under % filter as described in step 22
below.
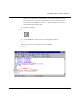
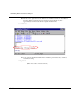
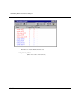
Double-clicking on any line in the Hierarchical Profile window will open the
Source window and allow you to view the relevant source code for that line. The
selected line will be highlighted in the Source window as shown below. (Here,
we’ve double-clicked store.vhd:43.)