
User's Guide


Devices
189
5.
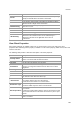
Select the Live Packet Capture option.
6. Specify the timeout interval in Timeout. The default timeout for packet level troubleshooting mode is
5 mins. Minimum allowed value is 1 minute and maximum is 720 minutes for the timeout.
7.
Select the type of packets you want to see while troubleshooting under Traffic Selection. If you want
to view all packets visible to the troubleshooting sensor, select the All packets on the channel
option. If you want to view only packets from the client visible to the troubleshooting sensor, select the
Only packets for the selected client <client MAC> option.
8.
Select the check box for the sensor using which you want to do the troubleshooting,from the list of
AirTight devices operating as sensors. The sensors seeing the device are sorted based on their
availability and signal strength.
9.
In the Protocol and Channel Selection section, select the protocols and channel for which you want
to troubleshoot. If you want to select a single channel, select the Select Channel option and specify
the channel number and Width (channel offset). By default, the protocol and channels are displayed
based on the device template applied to the troubleshooting sensor. You can select a different
protocol and/or channel, if required. Alternatively, you can select the Rotate on all Channels option,
to troubleshoot on all available channels.
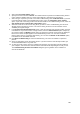
10.
Click Start Troubleshooting to start the troubleshooting. The sensor is enabled to capture live
packets.
11.
Select an appropriate tool for live packet capture. If you don't have the tools already installed, you
can download Wireshark or any other tool.
12.
To view the packet capture, open the command line interface of the operating system installed on
your computer, and execute the command shown under Wireshark depending on the tool you use.
The Troubleshooting in Packet Level Mode dialog box gives a guideline to the command to
execute for Wireshark.