
Specifications


3 Using Wind River Trace
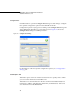
3.5 Using the Trace View
47
3
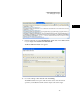
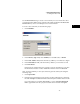
The Trace view has two fields: the Events field and the Trace field.
The Events field shows the trace buffer. When code runs, the Events field shows
the start of trace and the end of trace. It also displays the type of trace event.
The Trace field has five columns, from left to right: Event Occurrences (unlabeled),
Address, Abs Time, DEL Time, and Instruction (unlabeled.)
The Event Occurrences column shows the type of trace event.
The Address column shows the address or line number of the trace event.
The Abs Time column shows the absolute time, that is, the elapsed time since the
beginning of trace.
The DEL Time column shows the delta time, that is, the change in absolute time
since the last trace entry.
The Instruction column shows the executed instructions. To set the code display,
right-click in the Instruction field and select Show Code Level. From the list of
options, select Functions, Source, or Disassembly.
Figure 3-1 Trace View