
User guide


131
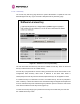
8.3.15 Diagnostics Plotter
The system has the diagnostics plotter facility shown in
Figure 67.
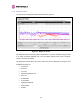
Figure 67 - Diagnostic Plotter
The diagnostic plotter allows the system administrator to view the cascading histogram data
in an easily accessible graphical form. The plot always displays three traces, maximum,
minimum and mean by default.
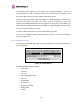
The diagnostic selector allows the user to select the various categories of histogram. The
available histograms are:
• Vector Error
• Rx Power
• Tx Power
• Signal Strength Ratio V/H
• Link Loss
• Rx Data Rate
• Tx Data Rate
• Aggregate Data Rate
• Receive SNR
• Rx Gain