
Datasheet

Uz210_02c_oi_e.doc / Dez-15 Page 20 / 27
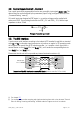
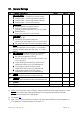
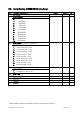
5.7. Linearization Setting
No.
Linearization Table
Range
Default
Ser.
050
First interpolation point (x0, original value)
E6
051
First interpolation point (y0 as substitution for x0)
…
052
Second interpolation point (x1, original value)
-10 000 … +10 000
0
…
053
Second interpolation point (y1 as substitution for x1)
…
etc. ---->
…
080
Last interpolation point (x15, original value)
…
081
Last interpolation point (y15 as substitution for x15)
H7
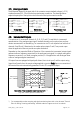
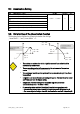
5.8. Hints for Use of the Linearization Function
The drawings below explain the difference between the settings
„Linear Mode“ = 1 and „Linear Mode“ = 2:
x
y
(x0)= 0
(y0)= 0
Linearization Mode
Setting "1"
x
y
Linearization Mode
Setting "2"
(x0)= -1000
(y0)= 900
(x8)= 0
(y8)= 750
(x15)= +1000
(y15)= - 600
*)
(x15)= 1000
(y15)= 800
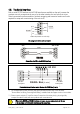
The x-values are to determine which originally measured input value should be
substituted by another value
The corresponding y value defines a new value for replacement of the previous
x value (e.g. the value x3 will be modified into y3)
Values between two interpolation points will be reproduced by straight lines (linear
interpolation)
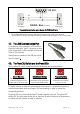
x-registers must use continuously increasing settings, i.e. P0(x) must have the lowest
and P15(x) must have the highest setting
Independent of all other settings the acceptable range for x values and
y values is always from -10 000 to +10 000.
For measuring values outside of the defined linearization range, please note:
- if a measuring value is lower than x0, the linearization result will always be y0.
- if a measuring value is higher than x15, the linearization result will always be y15.