
User Manual

CUEMIX FX
96
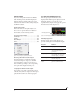
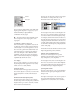
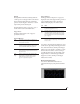
The info box
When any EQ filter point is selected or dragged in
the full window graph, the info box is shown next
to the point in the full graph display (Figure 9-35).
Figure 9-35: The Info Box.
The info box includes the industry standard
scientific note (pitch) name when the control point
is located at a frequency that resides within a
prescribed note range, where C4 is middle C. The
note number is accompanied by the number of
cents (±50) above or below the exact frequency for
the note. If the control point is dragged outside the
note range, only the frequency is shown.
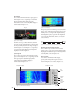
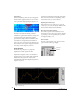
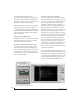
OSCILLOSCOPE
The Oscilloscope (Figure 9-36) graphs the
amplitude of an audio signal over time.
Amplitude is displayed on the y-axis and time is
displayed on the x-axis. A thick white vertical line
marks where time equals zero; a thick white
horizontal line marks where amplitude equals zero
(Figure 9-36, below).
Level meters are displayed to the right of the graph.
One or two meters are shown, depending on the
current view mode (see “View controls”).
Opening the oscilloscope
Each 828x has its own oscilloscope. To open an
oscilloscope, choose the Oscilloscope item from the
Devices menu under the desired interface.
Choosing a channel to display
The oscilloscope follows the currently focused
audio input or output. If you focus a mono channel
(e.g. Analog 3), its corresponding stereo pair will
be displayed (Analog 3–4).
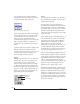
View controls
The View controls (Figure 9-37) provide several
options for the oscilloscope display.
Figure 9-37: View controls
Figure 9-36: Oscilloscope
Pause button
View menu