
User Guide


MOTU AUDIO TOOLS
74
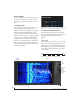
ANALYSIS MENU
Choose the desired form of audio analysis from the
Analysis menu (Figure 9-1). For details on each
analysis pane, see the following sections of this
guide.
LEFT/RIGHT INPUT
Choose the desired channel(s) you wish to scope
from the Left Input and Right Input menus
(Figure 9-1). These menus display the To C o m p u te r
channels configured in the MOTU Pro Audio
Control web app. The number of channels shown is
controlled by the From device to computer setting in
the Device tab. For example, if 18 channels are
specified, you’ll see 18 channels in the Left/Right
Input menus. Use the Routing tab to map desired
audio sources (listed across the top of the grid) to
the To Compute r audio channels, as demonstrated
in Figure 7-7 on page 62.
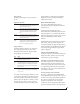
Figure 9-2: The ‘From device to computer’ setting determines how
many channels you see in the Left Input and Right Input menus.
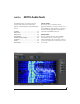
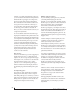
FFT AND SPECTROGRAM DISPLAY
The FFT analysis pane displays a real-time Fast
Fourier Transform (FFT) frequency measurement
and spectrogram “waterfall”, as shown in
Figure 9-3.
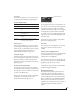
Spectrogram
The spectrogram scrolls from top to bottom, where
the top edge of the display represents what you are
hearing “now”. Color represents amplitude along
the left/right frequency spectrum. The amplitude
color scale runs from black (silence) to red (full
scale) as follows:
Figure 9-4: Spectrogram color-to-amplitude spectrum.
Figure 9-3: FFT and Spectrogram display.
View
controls
Y-axis labels
for FFT display
Horizontal
controls
Vertical
controls
Spectrogram
controls
Grow handle
FFT curve
Black Blue Green Yellow Orange Red
Silence Full scale