
User Manual


CUEMIX FX
81
FFT AND SPECTROGRAM DISPLAY
FFT and spectrogram information can be
displayed in the Filter response display section in
the EQ tab (Figure 9-10 on page 66) or as a
separate window (Figure 9-28 on page 81) opened
from the Devices menu (Figure 9-26).
Figure 9-27: Filter Display options menu
Filter display options
The Filter display options menu (Figure 9-27)
provides several options for the EQ filter display:
FFT display
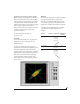
Choose Show FFT from the Filter display options
menu (Figure 9-10) to superimpose a real-time
Fast Fourier Transform (FFT) frequency
measurement curve over the EQ filter display, as
demonstrated in Figure 9-29:
Figure 9-29: FFT display.
The FFT curve is post-filter. Therefore, the FFT
shows the results of the EQ filter(s) being applied.
Use the global EQ button for the input or output
channel (Figure 9-3 and Figure 9-6, respectively)
to toggle between the EQ’d and non-EQ’d FFT
display for an A/B comparison.
Spectrogram
Choose Show Spectrogram from the Filter display
options menu (Figure 9-10) to superimpose a real-
time spectrogram “waterfall” display in the
background of the EQ filter display, as
demonstrated in Figure 9-30:
Menu option What it does
Show no analysis Turns off both the FFT and
Spectrogram in the Filter display.
Show FFT Shows/hides a real time FFT analysis
of the current signal being EQ’d,
post EQ filter.
Show Spectrogram Shows/hides a real-time spectro-
gram “waterfall” in the background
of the filter display, post EQ filter.
Show Band Response Shows/hides the colored area below
EQ filter points.
Show/Hide Full Window
Analysis
Shows/hides the enlarged filter dis-
play in the CueMix FX window.
Filter display options menu
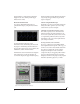
Figure 9-28: Full window filter display.
View
controls
Y-axis labels for EQ controls
Y-axis labels for FFT display
Horizontal
controls
Vertical
controls
Spectrogram
controls
Grow handle
FFT curve