
User Manual


CUEMIX FX
83
In Zoom/Offset mode, Zoom sets the display zoom
from 1x to 100x, where the number represents the
zoom factor relative to the entire frequency range.
For example, when the horizontal zoom value is 1x,
the entire frequency range from 10 to 24000 Hertz
is displayed; when the horizontal zoom value is 2x,
one half of the entire frequency range is displayed.
Pos determines which frequency is displayed at the
center of the graph.
In Min/Max mode, Min and Max set the lowest and
highest displayed frequencies (in Hertz).
Vertical controls (amplitude axis)
The Ve r t i c al controls (Figure 9-28) operate
similarly to the Horizontal controls, except that
they configure the y-axis (amplitude).
In Zoom/Offset mode, Zoom sets the display zoom
from 1x to 100x, and Pos sets the center amplitude
of the graph. In Min/Max mode, Min and Max set
the smallest and largest displayed amplitude.
Spectrogram controls
The Floor control (Figure 9-28) sets the amplitude
threshold for the spectrogram display, from -144
dB up to 0 dB.
The Alpha control (Figure 9-28) sets the opacity of
the spectrogram information displayed in the
graph, from 100% (fully visible) to 0% (hidden).
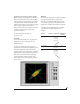
The info box
When any EQ filter point is selected or dragged in
the full window graph, the info box is shown next
to the point in the full graph display (Figure 9-35).
Figure 9-35: The Info Box.
The info box includes the industry standard
scientific note (pitch) name when the control point
is located at a frequency that resides within a
prescribed note range, where C4 is middle C. The
note number is accompanied by the number of
cents (±50) above or below the exact frequency for
the note. If the control point is dragged outside the
note range, only the frequency is shown.
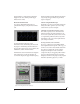
OSCILLOSCOPE
The Oscilloscope (Figure 9-34) graphs the
amplitude of an audio signal over time.
Amplitude is displayed on the y-axis and time is
displayed on the x-axis. A thick white vertical line
marks where time equals zero; a thick white
horizontal line marks where amplitude equals zero
(Figure 9-34, below).
Figure 9-34: Oscilloscope