
User Manual


CUEMIX FX
89
Monitoring control voltage output from Volta
MOTU’s Volta instrument plug-in for Mac OS X
turns your audio interface into a control voltage
interface, giving you precise digital control from
your favorite audio workstation software of any
hardware device with a control voltage (CV) input.
The CV signals output from Volta can be
monitored in the Oscilloscope, giving you visual
feedback on LFOs, envelopes, ramps, step
sequencers, and more.
For more information on Volta, see
www.motu.com.
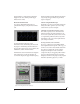
X-Y PLOT
The X-Y Plot window (Figure 9-42) graphs the
amplitude of a stereo audio signal on a two-
dimensional grid.
For each unit of time (i.e., each sample), the
amplitude of the left channel is displayed on the x-
axis and the amplitude of the right channel is
displayed on the y-axis. A thick white vertical line
marks where left channel amplitude equals zero; a
thick white horizontal line marks where right
channel amplitude equals zero (Figure 9-42,
below). There are also thick white diagonal lines
for y = x and y = -x.
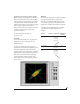
Metering
Level meters are displayed above and to the right of
the graph for the left (green) and right (red)
channels, respectively. An additional Correlation
meter (blue) is displayed on the right. This meter
displays the correlation between the two channels.
The higher the meter, the higher the correlation
between the two channels. Below are a few
examples:
Figure 9-42: X-Y Plot
Situation Meter level X-Y Plot graph Mathematical
relationship
Perfect correla-
tion
+1 Diagonal line
going from
lower left to
upper right:
y = x
Zero correlation 0 No discern-
ible pattern
None
Perfectly out of
phase
-1 Diagonal line
going from
upper left to
lower right:
y = -x