
User Manual


CUEMIX FX
91
In Min/Max mode, Min and Max let you scale the
grid by moving the -1.0 and +1.0 points along the
axis. Min/Max mode lets you control the graph
boundaries directly.
Persistence
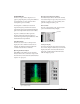
The Persistence controls (Figure 9-46) affect the
appearance of data from when it is first displayed
until it disappears from the grid.
Figure 9-46: The Persistence controls.
Length
Length (Figure 9-46) sets the number of recent
samples to show on the plot. For example, when
Length is set to 10,000, the 10,000 most recent
samples are shown.
Decay
The brightness (in Grayscale mode) or hue (in
Color mode) of each sample on the plot is
determined by a linear scale, with the most recent
sample displayed at the maximum value and the
oldest sample displayed at the minimum value.
Decay (Figure 9-46 on page 91) determines the
brightness or hue of the minimum value. When
Decay is zero, the oldest sample is black. When
Decay is +1.000, the oldest sample is fully opaque
(in Grayscale mode) or red (in Color mode).
War p
Wa r p (Figure 9-46) determines the position of data
points after they are first drawn. When warp is
zero, data points remain in the same position.
When warp is positive, they contract towards the
origin (center of the grid). When warp is negative,
they expand away from the origin. The further the
warp value is from zero, the greater the effect.
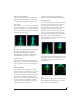
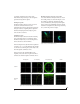
Using the X-Y Plot
The X-Y Plot helps you “see” the width of the stereo
field of a mix. It also helps you determine if a mix
has issues with polarity, as follows:
If a stereo signal is out of phase, it is not mono
compatible because it can cancel itself out, either
partially or nearly completely, when collapsed to
mono.
Figure 9-47: Checking polarity in a stereo signal with the X-Y Plot.
Activity on the X-Y Plot What it indicates
Signal activity occurs mostly
along the x = y axis (lower left
to upper right) and the Corre-
lation meter reading is high
Left and right channels are pre-
dominantly in polarity (the ste-
reo field is relatively narrow)
Signal activity occurs mostly
along the y = -x axis (upper left
to lower right) and the Corre-
lation meter reading is low
(near -1)
Left and right channels are pre-
dominantly out of polarity (not
in phase)
Signal activity occurs in a
seemingly random fashion
throughout the grid
No phase relationship exists
(i.e. it is probably a wide stereo
field)
I
n po
l
ar
i
ty
O
ut o
f
po
l
ar
i
ty
N
o po
l
ar
i
ty