
User`s manual


IA260/IA261/IA262/EM-2260 Linux User’s Manual Development Tool Chains
5-3
The following cross compiler tools are provided:
ar Manages archives (static libraries)
as Assembler
c++, g++ C++ compiler
cpp C preprocessor
gcc C compiler
gdb Debugger
ld Linker
nm Lists symbols from object files
objcopy Copies and translates object files
objdump Displays information about object files
ranlib Generates indexes to archives (static libraries)
readelf Displays information about ELF files
size Lists object file section sizes
strings Prints strings of printable characters from files (usually object files)
strip Removes symbols and sections from object files (usually debugging information)
On-Line Debugging with GDB
The tool chain also provides an on-line debugging mechanism to help you develop your program.
Before performing a debugging session, add the option -ggdb to compile the program. A
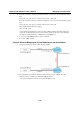
debugging session runs on a client-server architecture on which the server
gdbserver is installed
in the target computer and the client ddd is installed in the host computer. We’ll asuumne that you
have uploaded a program named hello-debug to the target computer and started debugging the
program.
1. Log on to the target computer and run the debugging server program.
#gdbserver 192.168.4.142:2000 hello-debug
Process hello-debug created; pid=38
The debugging server listens for connections at network port 2000 from the network interface
192.168.4.142. The name of the program to be debugged follows these parameters. For a
program requiring arguments, add the arguments behind the program name.
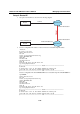
2. In the host computer, change the directory to where the program source resides.
cd /my_work_directory/myfilesystem/testprograms
3. Execute the client program.
#ddd --debugger arm-linux-gdb hello-debug &
4. Enter the following command at the GDB, DDD command prompt.
Target remote 192.168.4.99:2000
The command produces a line of output on the target console, similar to the following.
Remote debugging using 192.168.4.99:2000
192.168.4.99 is the machine’s IP address, and 2000 is the port number. You can now begin
debugging in the host environment using the interface provided by DDD.
5. Set a break point on main function by double clicking, or by entering
b main on the command
line.
6. Click the cont button.