
User`s manual


EDS-P510 Series Featured Functions
3-72
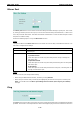
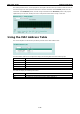
LLDP Table
Port Neighbor ID Neighbor Port Neighbor Port Description Neighbor System
Port: The port number that connects to the neighbor device.
Neighbor ID: A unique entity which identifies a neighbor device; this is typically the MAC address.
Neighbor Port: The port number of the neighbor device.
Neighbor Port Description: A textual description of the neighbor device’s interface.
Neighbor System: Hostname of the neighbor device.
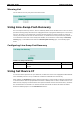
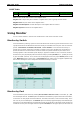
Using Monitor
You can monitor statistics in real time from the EDS-P510’s web console and serial console.
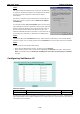
Monitor by Switch
Access the Monitor by selecting “System” from the left selection bar. Monitor by System allows the user to view
a graph that shows the combined data transmission activity of all the EDS-P510’s 18 ports. Click one of the four
options—Total Packets, TX Packets, RX Packets, or Error Packets—to view transmission activity of
specific types of packets. Recall that TX Packets are packets sent out from the EDS-P510, RX Packets are
packets received from connected devices, and Error Packets are packets that did not pass TCP/IP’s error
checking algorithm. The Total Packets option displays a graph that combines TX, RX, and TX Error, RX Error
Packets activity. The graph displays data transmission activity by showing Packets/s (i.e., packets per second,
or pps) versus sec. (seconds). In fact, three curves are displayed on the same graph: Unicast packets (in red
color), Multicast packets (in green color), and Broadcast packets (in blue color). The graph is updated every
few seconds, allowing the user to analyze data transmission activity in real-time.
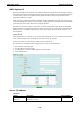
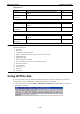
Monitor by Port
Access the Monitor by Port function by selecting ALL 10/100M or 1G Ports or Port i, in which i= 1, 2, …, G2,
from the left pull-down list. The Port i options are identical to the Monitor by System function discussed above,
in that users can view graphs that show All Packets, TX Packets, RX Packets, or Error Packets activity, but in
this case, only for an individual port.
The All Ports option is essentially a graphical display of the individual port
activity that can be viewed with the Console Monitor function discussed above. The All Ports option shows three
vertical bars for each port. The height of the bar represents Packets/s for the type of packet, at the instant the