
User Guide

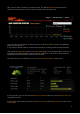


Next, after at least 7 minutes of connection time, the WTFast Statistics screen will show
statistics of the connection. The top section of that screen looks like this.
Here, you can see the WTFast connection latency as the green graph, and the corresponding
Internet connection in red.
In this case the WTFast latency is lower than the Internet, showing connection improvement.
Also, below the Ping Graph, there is the Lost Packets graph. In the example above, there are no
lost packets for both the WTFast and the Internet connection. If there were, there would be
small bars located at the time the packet loss occurred.
The other section of the Statistics screen is the Connection Statistics, shown below.
In the top frame, you can see how many Active connections there are, and the Active server on
the WTFast network.
In the bottom frame, the key statistics are the 10 Sec Ping and the Ping Average, as well as the
Lost Packets.
3