
Owner manual

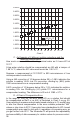
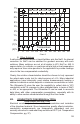
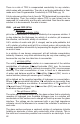
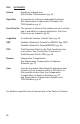

Chart 1
0 5 10 15 20 25 30 35 40 45 50 55 60
1.500%
1.600%
1.700%
1.800%
1.900%
2.000%
2.100%
2.200%
2.300%
2.400%
2.500%
KCl % / °C
% / °C
Temperature
C.
resulting compensation
uncompensated conductivity.
D. A Chart of Comparative Error
Users wanting to measure natural water based solutions to 1% would have
compensation may want to stick with it, regardless of increasing error as
II will provide the repeatability
and convertibility of data necessary for relative values for process control.