USER'S GUIDE Model 8718B Electromagnetic Radiation Survey Meter narda Safety Test Solutions P/N 42983600 RevB an L3 communications company
1 Introduction About the Model 8718B Your Model 8718B is a hand-held, battery-powered meter designed to simplify the measurement of electromagnetic fields. It can be used with any Narda 8700 Series probe. The 8718B is an upgraded version of the original Model 8718. Although there are many enhancements, the 8718B is most easily distinguished from its predecessor by the quick-release style probe connector.
User’s Guide Updates This User’s Guide was thoroughly reviewed for accuracy prior to publication. Corrections to this guide necessitated by errors or omissions or by minor revisions to the meter firmware will be covered in the README file enclosed with the User's Software. The README file is available at any time from the HELP menu within the User's Software.
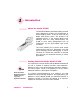
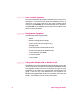
2 Understanding Your Model 8718B General Description It is important to be familiar with the Model 8718B before you use it. This section includes descriptive data keyed to highlighted illustrations to help you locate the various features of the meter. The descriptions not only identify the features but tell you how they are used. Battery Charger and Power Cord The battery charger and power cord are used to recharge the battery within the Model 8718B.
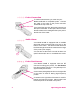
Probe Connection To make measurements, you must use your Model 8718B with a compatible probe. Connect the cable of the probe to the probe connector located at the top of the unit. If you use a fiber optic link, the probe connects to a fiber optic transmitter. A fiber optic cable connects the transmitter to the rectangular fiber optic jack on the left side of the meter. Audio Alarm Your Model 8718B is equipped with an audible alarm that emits sound through a tiny hole on the bottom of the meter.
Strap and Tripod Mount A strap is provided on the underside of the Model 8718B. It has a hook and loop closure to permit easy adjustment, around your hand. Behind the strap is a threaded connector used to secure the meter to a tripod. Loosen the strap to access this connector. Operation With a Computer To update probe calibration information or retrieve stored measurements, you must connect your Model 8718B to a personal computer and use the User's Software provided by Narda.
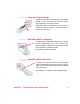
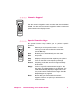
Keypad Note The keys on the 8718B must be firmly depressed to perform their function and give a tactile feedback when properly depressed. The Model 8718B has four groups of keys distinguished by their color. Function keys (green) Numeric keys (yellow) Special Function keys (white) Power keys (blue, green) Power Keys Two power keys are used to turn the Model 8718B On and Off.
Numeric Keypad Use the numeric keypad to enter number data into the Model 8718B. You also use the numeric keypad to select a numbered option listed on the display screen. Special Function Keys Six special function keys enable you to perform specific functions. Chapter 2 Esc Returns you to the previous menu. In a few cases you must enter a selection rather than use the Esc key. Auto Zero Enables you to automatically zero the meter and probe. Help Displays a help screen that explains your options.
8 Operating the Meter
3 Probe Selection Introduction The 8700 series RF measurement system offers a very broad selection of probes. The factors that you should consider in selecting the probe, or probes, best suited for your task are described in this section. Key Factors in Selecting a Probe FREQUENCY RANGE The probe frequency range should include the frequencies of all the emitters to be surveyed at one time.
FLAT RESPONSE OR SHAPED FREQUENCY RESPONSE Flat response probes are the most common. Narda’s patented shaped frequency response probes read out in Percent of Standard and are particularly useful in complex, multi-signal environments where exposure limits are different for the various emitter frequencies and in classified environments. SIZE AND MINIMUM MEASUREMENT DISTANCE The majority of the 8700 series probes have four-inch (10 cm) diameter heads.
Note It is important to understand that each shaped frequency response probe model is designed to conform to a particular standard. The readout on the 8718B is shown in terms of Percent of Standard. The full scale of Narda’s shaped probes is typically either 300% or 600% of a standard.
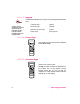
Probe Identification Narda 8700D series probes use the following labels and indicators: • Certified Calibration Date Label • Model Identification Label Field Type (E or H) Full Scale Measurement Range Model Number Standards (Shaped Probes Only) Frequency Range Serial Number • Color Band to Indicate the Full Scale Measurement Range (20 mW/cm2 probes do not have a colored band) • Calibration Label With Frequency Correction Factors Correction Factor Listed for Every Calibration Frequency Model Number and
4 Making a Measurement Introduction This chapter will help you make measurements with your Model 8718B. Information is included for turning the meter on, selecting, zeroing, and testing a probe, plus an explanation of the main measurement screen of the meter. Some general information is also included about measurement surveys, precautions you should observe, and the use of probe correction factors. Getting Started Press the On power key.
Entering the Probe Model Note The single most important thing you must do is tell the 8718B meter which probe you are using. Narda's 8700 Series system is completely modular — all 8700 series meters work with all 8700 series probes. The single most important thing you must do is tell the 8718B meter which probe you are using. The Model 8718B has the basic characteristics of every 8700 Series probe stored in its internal memory.
To select from the PROBES IN MEMORY... 1. If you haven’t already, press F1 (MEASURE). 2. The model number and the serial number of the last probe used will be displayed on the second line of the display. If you want to use the same probe, press Enter. SE MOD E L OR S E L 8 7XX 8 F1 L A E 7 EC T PROB E 8 7 2 2D SNXXXXX C T F ROM L I S T X X 8 7 X X MOR E F2 F3 F4 3. If you want to use a different probe, look for the model number in the positions above the F1, F2, or F3 legends.
To use a PROBE that is NOT IN MEMORY... 1. If you haven't already, press F1 (MEASURE). 2. The model number of the last probe used will be displayed on the second line of the display. If you want to use the same model probe, press Enter. SE MOD E L OR S E L 8 7XX 8 F1 3. You must return to the Opening Menu Screen and repeat the probe selection and zeroing process if you want to change probes. Press 7 (Probe) from the First Menu Screen and then press F4 (RESTART).
A8 7 2 2D SNXXXXX 3 0 0 k H z - 5 0 GH z E - F LD 3 0 0 % STD SHAPED YES NO MENU F1 7. F2 F3 F4 Proceed with the probe zeroing process. Zeroing the Probe The probe and meter must be “zeroed” together. It is important that the probe is not exposed to radiated fields during the zeroing process. The storage case is shielded and provides a convenient “zero density” environment. Note Position the probe in the case with one test point pointed downward and the other two test points above the foam.
Note See Chapter 12, Probe Zero, for additional information on the characteristics of the survey system including the causes of zero drift. • The field strength is not low enough. Move away from the RF field source, use the storage case to zero the probe. • The probe is damaged. Try another probe. To reconfirm the zero while the instrument is in use... 1. Establish a zero density environment for the probe as before. 2. Press the Auto Zero key.
Main Measurement Display Screen (Shaped Probes) FIELD STRENGTH • Indicates actual measured value • Unit of measure is always % STD for shaped frequency response probes BAR GRAPH • Indicates approximate field strength • 100 segment, three 10:1 (10 dB) ranges MAXIMUM VALUE • Indicates the maximum value that has occurred since you began making measurements or since resetting the maximum using F2 (MAXR) • The unit of measure is the same as for the instantaneous value shown on the line above. 1 2 . 1 2 7 .
Alternate Measurement Display Screen Note The Alternate Measurement Display Screen should only be used for single frequency measurements or where all emitter frequencies are close and the exposure standard has the same limits. Refer to Using Probe Correction Factors on page 24. The Alternate Measurement Display Screen is very similar to the Main Measurement Display Screen with one difference.
Alternate Measurement Display Screen (Shaped Probes) FIELD STRENGTH • Indicates actual measured value • Unit of measure is always % STD for shaped frequency response probes BAR GRAPH • Indicates approximate field strength • 100 segment, three 10:1 (10 dB) ranges CALCULATED FIELD STRENGTH • Displays field strength in mW/cm2 that has been calculated from the % STD reading using the referenced standard and the indicated frequency 1 2 . 1 % STD 1 0 . 0 0 GH z 0 .
Note Alternate values cannot be calculated at low frequencies for standards with very high magnetic field limits. A “greater than” symbol (>) is shown under these conditions. 22 4. Change the units (if needed) by pressing either F1 (kHz), F2 (MHz), or F3 (GHz). 5. Press F4 (SAVE). The probe correction factor will be displayed briefly if you are using a probe in memory and you will automatically return to the measurement screen. See Using Probe Correction Factors on page 24. 6.
Bar Graph Ranges The Range key is used to control how the bar graph displays information. The digital display is not affected and the meter automatically displays a digital value over the probe’s entire measurement range. There are four available settings: AUTO, HIGH, MID, and LOW. The bar graph has 100 divisions. Note The Range Key only affects how the bar graph displays information.
get a deflection on the bar graph but the amount of deflection is not important. Repeat for the other two test points to insure that the probe is working correctly. The D series magnetic field probes have a single, conductive test point that is used to simultaneously test all three sensors. Note A probe that does not show a movement of the bar graph for all three (or six) tests may be damaged and should not be used to make measurements.
• When there are multiple emitters with frequencies that are close to each other and the nearest calibration frequencies have very similar correction factors. Correction factors should NOT be used: • When the frequencies of the emitters are diverse. Correction factors may vary considerably and there is no way to determine the distribution of energy from the various emitters. It is more accurate not to use a correction factor under these conditions. See Measurement Uncertainty on page 27.
To use a correction factor for a probe NOT in memory... 1. Press F3 (MENU). The First Menu Screen will appear. 1 2 3 4 D T S B A T A L OG I ME A VG PAT I AL AT / L I FE F1 2. UN I TS RS2 3 2 PROB E NEXT F3 F4 Press 8 (NEXT) to access the Second Menu Screen. 1 2 3 4 26 F2 5 6 7 8 COR F AC T S E T T I NGS CABLE / FO L OCKOU T 5 6 7 8 F1 F3 F2 A S B B L T L A A RM NDS ANK CK F4 3. Press 1 (COR FACT). A screen will appear that shows the correction factor. 4.
Checking or Changing the Probe Model To check the probe model that the meter is currently set to... 1. Press F3 (MENU). The First Menu Screen will appear. 2. Press 7 (PROBE). A Screen will appear that shows the model number and basic characteristics of the probe. The probe serial number is shown for probes selected from memory. 8 7 1 2D SN 1 2 3 4 5 3 0 0 MH z _ 5 0 GH z E_ F LD F LAT 2 0 mW / c m 2 OK RESTART F1 F2 F3 F4 3. Press F1 (OK) key to return to the First Menu Screen. 4.
• Ellipse ratio is ±0.75 dB or better, depending on the model of the probe. The ellipse ratio is the ratio of readings that occur when one rotates the probe around the axis of its handle. Narda calibrates its probes by rotating the probe about its axis and using the mean value to determine the correction factor. If you rotate the probe around its axis and use the mean value, ellipse ratio can be eliminated as a source of uncertainty.
5 Using the Menu System General The menu system allows you to store data and to select various operating modes. It is accessed by pressing the appropriate function key that corresponds to MENU on the bottom line of the display screen. The menu is comprised of two menu screens and several sub-menus. Press the number on the keypad that matches the number on the menu to make your selection. Instructions or sub-menus appear when one of the basic menu options is selected.
First Menu Screen 1 2 3 4 D T S B A T A L OG I ME A VG PAT I AL AT / L I FE F1 Key Menu F2 5 6 7 8 UN I TS RS2 3 2 PROB E NEXT F3 F4 Options Chapter Log with time and date stamp. 1 DATA LOG Log spatially averaged values with time and date stamp. 8 Continuous logging at various rates. 2 TIME AVG 3 SPATIAL 4 BAT/LITE Turn fixed time duration) on or off. averaging (various Turn the spatial averaging mode (used for whole body averaging) on or off.
Second Menu Screen 1 2 3 4 COR F AC T S E T T I NGS CABLE / FO L OCKOU T 5 6 7 8 F1 F3 Key Menu 1 COR FACT F2 A S B B L T L A A RM NDS ANK CK F4 Options Enter a numeric probe correction factor. Chapter 4 Check or set the meter’s internal clock (time/date) 2 SETTINGS Enter a value for temperature. Used when the probe is separated from the meter and operating at a different ambient temperature. Clear the memory of logged data. 15 Set the function keys for right or left handed operation.
Menu Commands The following is a list of menu commands that are shown on the fourth line of the display and selected by using the four function keys (F1-F4). 32 AUTO Auto – returns the meter to the normal, automatic temperature correction mode. ABORT Abort clearing the memory BEGIN Begin – confirms that the meter is ready to perform time averaging to meet the requirements of a specific standard. CABLE Cable – changes the meter input from fiber optic receiver to the standard cable input.
MAIN Main – switch to the Main Measurement Display Screen. MAXR Maximum Reset - reset the maximum value to the instantaneous value. MEASURE Measure – begin the measurement process by selecting and zeroing the probe. Chapter 5 MEM Memory – display the available memory. MENU Menu – access the First Menu Screen. MIN Minutes – used to define a logging interval. MHz MHz – used to enter a frequency. NO No – the current probe selection is incorrect. Return to the menu to make another selection.
Default Conditions Upon Turn-On The Model 8718B is designed to automatically return to a basic set of operating parameters every time it is turned on. Although in some cases this may require additional key strokes to set up the meter as desired, this feature is designed to minimize the chance of making measurements while unknowingly having the meter incorrectly configured. The table below lists the operating parameters that can be expected upon turn-on.
Chapter 5 Time Averaging OFF Unit of Measure Last Used unit of measure will be in use if previous and current probe both have flat or shaped frequency response. If current probe is shaped, unit will be % of STD. If current probe is flat and previous probe was shaped, then unit will be mW/cm2.
36 Operating the Meter
6 Units of Measure Available Units of Measure The 8718B Meter allows you to quickly select any unit of measure that is appropriate for the probe in use. The available units of measure depend on whether the probe is designed to measure the electric field or the magnetic field. It also depends on whether the probe has a “flat” frequency response or a “shaped” frequency response.
Changing the Unit of Measure To change the unit of measure that the meter is set for ... 1. Access the menu system by pressing the function key that corresponds to the legend below MENU on the bottom line of the display. 2. Press the number 5 on the keypad to select UNITS from the First Menu Screen. A screen will appear that offers the available units of measure for the probe in use. 1 2 3 mW / c m W/ m 2 V / m F1 38 2 6 7 F2 F3 V 2 / m 2 p J / cm 3 F4 3.
7 Spatially Averaged Measurements Understanding Spatial Averaging The major standards concerned with human exposure to radio frequency radiation specify maximum exposure levels averaged over the whole body. The co-linear dipole antenna arrays that are very common in modern wireless communications systems, for example, have multiple lobes close to the antenna. The field strength typically varies by 6-7 dB along the length of an array.
Spatial Averaging with the 8718B The Model 8718B uses time to quickly make precise, spatially averaged measurements. With the 8718B set for spatial averaging, press the F1 function key to start the timer. Pressing the same key again stops the timer. During this interval of time, the meter takes a large number of measurements. The results are presented as both an average value and a peak value.
6. Note It is important to move the probe vertically at a constant rate to obtain an accurate spatially averaged measurement. Press F1 (START) while slowly moving the probe vertically at a constant rate of movement. 2 4 . 2 % STD 3 9 . 5 MAX S T AR T MA XR F1 F2 The averaging time resolution is approximately 1/4 second. F3 F4 7. Strive for an interval of about ten seconds between starting and stopping the timer. The meter will beep every second as a timing aid. 8.
10. To make another spatially averaged measurement, press F1 (START) again. 11. To temporarily suspend the spatial average mode and make real time measurements, press F2 (CLR). To make another spatially-averaged measurement, press F1 (START) again. 12. To end spatial averaging altogether, press F4 (QUIT). The meter will automatically return to the standard measurement screen. If you had accessed the menu system from the Opening Menu Screen, you will return to that screen. 13.
8 Data Logging Logging Options The 8718B Meter features several methods of collecting data. The basic choices are: • Logging Data with the Meter. The logged data stored in the meter is downloaded to a computer at a later date using the User's Software, where it can be viewed and printed. The data can also be exported in spreadsheet or database formats for further processing. • Continuous Output to a Computer. Data collection, if any, is performed by the computer. • Analog Output.
Mode 2 • Collect a series of up to 999 spatially-averaged data Mode 3 • Automatically collect a series of data points at specific points, one at a time, and automatically assign a reference number to each data point. Both the average value and the maximum value at each location are stored. The reference numbers can refer to either site plan locations or to a diagram of the industrial equipment being surveyed. Each data point also has a time and date stamp. intervals of time for a specific time period.
Note If you access the menu system from the Opening Menu Screen, you will return to that screen. Once a probe has been selected and zeroed, the measurement screen will reflect the logging mode that you have selected. To initiate one of the three logging modes described above... 1. Access the menu system by pressing the function key that corresponds to the legend below MENU on the bottom line of the display. 2. Press the number 1 on the keypad to select DATA LOG from the First Menu Screen. 3.
Mode 1 Logging To initiate Mode 1 logging (a series of data points with a reference number assigned to each data point)... 1. Press the number 1 on the keypad to select LOG WITH REF # from the logging menu screen. 2. A screen will appear requesting that you assign a twodigit survey number to this logging run of data points. Use the numeric keypad to enter the two-digit number and then press F1 (OK) or ENTER.
6. A screen will appear that indicates the value of reading that has been temporarily stored in memory and the number of the data point. The first data point will be 001. DATA 1 2 . 1 % PO I NT STD SAVE NO . 0 0 1 D I SCARD F1 F2 F3 F4 7. Press F1 (SAVE) to permanently log this data point into the meter’s memory with its associated data point number. The meter will automatically return to the measurement mode. 8. Press F3 (DISCARD) to erase the data point from the meter’s temporary memory.
13. Use the numeric keypad to enter a new two-digit survey number and then press F1 (OK) or ENTER. Again, make note of this number so that you can later associate this survey number with the data points collected. If you make a mistake, press F2 (CLR) to clear the screen and enter a new survey number. The meter will automatically return to the logged measurements screen. 14. To end logging altogether and return to the standard measurement screen, press F4 (QUIT).
N EW L OGG I NG RUN : E N T ER N EW RE F NO . _ _ OK F1 CLR F2 F4 Press F4 (QUIT) or F3 (MENU) if you change your mind. 4. The meter will automatically return to the measurement screen with new options available for the function keys. F1 F2 CF 1 . 0 0 END QU I T F3 F4 5. Proceed to make measurements as normal. To initiate making a spatially-averaged measurement that will be logged, hold the meter in one hand and the probe in the other with the head of the probe touching the ground. 6.
1 2 . 1 % STD 2 7 . 5 MAX STOP F1 9. F2 CF F3 1 . 0 0 F4 A screen will appear that indicates the average and maximum values of the reading that has been temporarily stored in memory and the number of the data point. The first data point will be 001. DATA 1 2 . 1 % 2 7 . 5 % SAVE F1 PO I N T NO . 0 0 1 STD AVG STD MA X D I SCARD F2 F3 F4 10. Press F1 (SAVE) to permanently log this data point into the meter’s memory with its associated data point number.
15. To end this logging run and begin a new run, press F3 (END). The screen will appear that allows you to enter another two-digit survey number. N EW L OGG I NG RUN : E N T ER N EW RE F NO . _ _ OK F1 CLR F2 MENU F3 QU I T F4 16. Use the numeric keypad to enter a new two-digit survey number and then press F1 (OK) or ENTER. Again, make note of this number so that you can later associate this survey number with the data points collected.
2. A screen will appear requesting that you assign a twodigit survey number to this logging run of data points. Use the numeric keypad to enter the two-digit number and then press F1 (OK) or ENTER. Make note of this number so that you can later associate this survey number with the data points collected. N EW L OGG I NG RUN : E N T ER N EW RE F NO . _ _ OK CLR F1 3. F2 MENU F3 QU I T F4 A new menu screen will appear that offers five different logging rates: 1/SEC, 10/MIN, 1/MIN, 10/HR, and 2/HR.
6. To log for a specific interval of time, enter a two-digit number on the keypad. If you make a mistake entering a number, simply continue entering numbers until the correct value is displayed. Then press either F1 (SEC), F2 (MIN), or F3 (HRS) and the meter will automatically return to the measurement screen with new options available for the function keys. 7. To log for an indeterminate interval of time (until you tell the meter to stop or the memory is filled), press F4 (CONT).
10. A screen will appear requesting that you assign another two digit survey number to the new logging run. Use the numeric keypad to enter the two-digit number and then press F1 (OK) or ENTER. Again, make note of the number for later use. If you make a mistake, press F2 (CLR) to clear the screen and enter a new survey number. The meter will automatically return to the logged measurements screen. N EW L OGG I NG RUN : N EW RE F NO .
3. Press F2 (MEM). 4. A screen will appear showing the approximate amount of available memory and the amount of memory already used. The bar graph is a rough indicator of remaining memory capacity as a percentage of total capacity. A V A I L A B L E M EMOR Y 1 0 k B A V A I L , 1 5 k B US E D MENU QU I T F1 F2 F3 F4 A record contains a header and one or more data points. To estimate the approximate number of data points and records (logging runs) that can be stored with the available memory ...
7. To discard the contents of the meter’s memory once the contents have been downloaded or without saving the information, access the menu system by pressing the function key that corresponds to the legend below MENU on the bottom line of the display. 8. Press 8 (NEXT) to get to the Second Menu Screen. 9. Press 2 (SETTINGS). 10. A new screen will appear offering several options. 1 2 3 S E T T I NGS C L OCK 4 RGT / L E F T T EMP 5 D I SPLAY C L E A R MEMOR Y F1 F2 F3 F4 11. Press 3 (CLEAR MEMORY).
9 Time-Averaged Measurements Measurement Options The 8718B meter features two averaging modes: Mode 1 • Perform fixed-time averaging over any one of several Mode 2 • Perform averaging to meet the requirements of a specific time intervals. specific standard. The averaging period is automatically set by meter. Making Time-Averaged Measurements To make time averaged measurements ... 1.
Mode 1 Averaging To initiate Mode 1 averaging (fixed time averaging over any one of several specific time intervals)... 1. Press number 1 on the keypad to select FIXED TIME from the averaging menu screen. Selecting Mode 1 averaging will automatically shut off Mode 2 averaging if it is on. 2. A new menu screen will appear that offers four different averaging intervals: 30 SEC, 1 MIN, 6 MIN, and 30 MIN.
5. The meter will continue to make real-time measurements until you initiate making the timeaveraged measurement. 6. Determine where you want to make the averaged measurement and place or hold the probe in the desired position. For short intervals, it may be practical to hold the meter in one hand and the probe in the other. For longer intervals, it is suggested that you place the probe on some form of non-conductive stand so that it does not move.
2 4 . 2 % 3 9 . 5 M A X S T D S T A R T C L R F1 F2 A V E R A G E 1 0 . 4 M E N U F3 S E C Q U I T F4 11. To make another time-averaged measurement over the same interval, press F1 (START) again. 12. To temporarily suspend the time average mode (once the current measurement interval has been completed or stopped) and make real time measurements, press F2 (CLR). To make another time-averaged measurement over the same interval, press F1 (START) again.
Note The PAUSE feature can be useful when measuring the average value from certain rotating radars. The effective measurement technique requires you to pause during the period of time when you are not in the beam of the radar. Continue this technique for two or more revolutions (depending on the RPM) to obtain a realistic average value of the field in the beam at your location. For details on this measurement technique, see Radar Measurements in the Applications Booklet. 2.
To set the meter for a specific frequency... 1. Press F4 (FREQ) from the measurement screen. A new screen will appear to allow you to enter a frequency. F REQUENCY : _ _ . _ _ GH CORREC T . F AC TOR : 1 . 0 0 62 k Hz MH z GHz F1 F2 F3 SAVE F4 2. Enter the frequency that you want to use for the timeaveraged measurements. Make sure you fill in all four positions. If you make a mistake just enter more digits until correct. For greater accuracy, use the units that allow the larger number.
To initiate Mode 2 averaging (averaging to meet the requirements of a specific standard)... 1. Make sure that the meter is set for the correct standard or change it if needed. See Chapter 11, Using the Standards Feature. 2. Make sure the meter is set to the correct frequency for the measurement you are making. See page 64. 3. Press number 2 on the keypad to select STANDARDS AVG from the averaging menu screen. Selecting Mode 2 averaging will automatically shut off Mode 1 averaging if it is on. 4.
7. The meter will continue to make real time measurements until you initiate making the timeaveraged measurement. 8. Press F1 (START) when you are ready to begin the time-averaged measurement. 9. The averaged value is displayed on the screen and will flash every second each time it is updated. The meter will automatically stop at the end of the averaging interval, which was determined by the standard and the frequency. 10.
Note The PAUSE feature can be useful when measuring the average value from certain rotating radars. The effective measurement technique requires you to pause during the period of time when you are not in the beam of the radar. Continue this technique for two or more revolutions (depending on the RPM) to obtain a realistic average value of the field in the beam at your location. For details on this measurement technique, see Radar Measurements in the Applications Booklet. 13.
To change the frequency... 66 1. To change the frequency (once the current measurement interval has been completed or stopped), press F2 (CLR) if the averaged value is displayed. 2. Once the meter is displaying real time values, the frequency menu is accessed by pressing F3 (FREQ). 3. Proceed as previously described to set the meter to a new frequency.
10 Alarm Settings Alarm Description The Model 8718B Meter is equipped with an audible alarm that emits sound through a tiny hole on the bottom of the meter. The alarm sounds automatically whenever the field strength exceeds the measurement range of the probe or over ranges. The meter can also be set to sound its alarm at a specific level and/or to sound a variable tone indication of field strength.
4. The left side of the display gives the status of the fixed alarm. It indicates whether the fixed alarm is either on or off and the current alarm threshold setting in terms of percent of full scale of the probe in use (1% to 99%). 5. The right side of the display indicates whether the variable tone alarm is either on or off. 6. The bottom line of the display indicates which function key (F1-F4) is used to turn the two alarms on or off.
Variable Tone Alarm Note The fixed and variable tone alarms operate independently of each other. The meter can be set to have both alarms off, either one of the alarms on, or both alarms on. If both alarms are turned on, the variable tone rate will vary with the field strength unless the measured field strength exceeds the fixed alarm threshold. The alarm will then sound a continuous tone. 1. Use F3 (ON) or F4 (OFF) to change the status of the fixed alarm.
70 Operating the Meter
11 Using The RF Exposure Standards Feature Application The Model 8718B Meter is always set to reference a particular safety standard, regulation, or guidance. The 8718B uses the referenced standard in two ways: • The Alternate Measurement Display Screen displays additional information about the instantaneous measurement at a particular frequency. See Alternate Measurement Display Screen on page 20. • Time-averaged measurements are made to conform to the referenced standard at the specified frequency.
Note Many standards have more than one tier, i.e., IEEE C95.1-1999 establishes different Maximum Permissible Exposure (MPE) levels and averaging times for Controlled Environments and for Uncontrolled Environments. I EEE C9 5 . 1 - 1 9 9 9 CON T RO L L ED ENV I R OK STNDS F1 5. F2 F3 F4 Press F1 (OK) to continue using this standard as a reference without change. To change the standard or tier that the 8718B references... 6. Press F4 (STNDS).
9. Press F1 (OK) to begin using this standard as a reference. 10. Alternately, press F4 (STNDS) to select another standard. For standards with two or three tiers... 11. A new screen will appear that lists the complete standard number at the top of the display. The available tiers will be listed below the basic standard. Note Changing the level referenced on a multi-tier standard does NOT change the characteristics of a probe ie.
74 Operating the Meter
12 Back Light and Battery Status Application for Back Light The liquid crystal display (LCD) on the Model 8718B Meter provides high contrast in bright outdoor lite. However, LCD’s do not generate any light and can be difficult to read in low light conditions. The LCD on the 8718B contains a high brightness back light that can be turned on whenever it is needed.
Battery Capacity The Model 8718B Meter uses a custom rechargeable battery. Under normal conditions, the battery provides about 20 hours of use before it must be recharged. The two features on the 8718B that significantly increase the current draw and therefore reduce the operating time are the back light and the RS232 serial port. It is for this reason that the default condition upon turn-on for both these features is off. Operating time with the back light on is about 6.5 hours.
4. Press the ESC key to return to the First Menu Screen. Press it again to return to the measurements screen. Accuracy of Battery Status Indicator The characteristics of Ni-Cad rechargeable batteries make it difficult to provide a truly accurate indication of charge level. This is because there is very little voltage difference over a broad range of charge levels. The battery status indicator on the 8718B is reasonably accurate when indicating charge levels of more than 80% or less than 20%.
78 Operating the Meter
13 Keypad Lockout and Display Blanking Description The Lockout feature disables the keypad to prevent inadvertent changes in operation. This feature can be useful while climbing and/or if the meter is left unattended during a long data logging session. The Blank feature both disables the keypad and blanks the display. This feature can be useful if the meter is left unattended during a long data logging session. Keypad Lockout To lock the keypad... 1.
Display Blanking and Keypad Lockout To both blank the display and lock the keypad... 1. Access the menu system by pressing the function key that corresponds to the legend below MENU on the bottom line of the display. 2. Press number 8 (NEXT) to select the Second Menu Screen. 3. Press 7 to select BLANK. 4. The meter will automatically return to the measurements mode but will be blank. The keypad will also be locked. Only the Off key will respond to commands individually.
14 Probe Zero Understanding the Zero Function The purpose of “zeroing” the probe and meter is to set the meter to indicate a zero field strength when there is no measurable field strength. The Narda 8700 series survey system maintains measurement accuracy under all conditions by insuring that all probes always provide true RMS (Root Mean Squared) indications of field strength. Diode detectors, which are used in many of Narda’s electric field probes, are always operated in the square law region.
Causes of Zero Drift All sensors have a change in output that is a function of temperature. In a probe, it is both the thermal coefficient of the detector and the gain of the probe amplifier that determine how much a probe drifts over temperature. Thermal compensation circuitry in the probe is used to minimize the impact of temperature change.
1 2 . 1 2 7 . 5 AL T F1 RE % MA MA AU TO - Z ERO STD X CF 1 . 0 0 XR MENU FREQ F2 F3 F4 • Whenever the meter continues to show low-level values and never seems to get back to a zero-field condition, positive zero drift is a possibility. This can be confirmed by shielding the probe to see if the meter goes back to a zero reading. See Shielding the Probe on the following page for suggested methods.
Shielding the Probe The probe must be shielded from significant RF fields whenever it is zeroed with the meter. This is to establish a zero reference for the field. There are four ways to shield the probe during zeroing: Note The Electric Field Attenuator can not be used to zero magnetic field probes. • Use the Model 8713B Electric Field Attenuator supplied with the meter. This conductive fabric is the same material that is used in RF protective clothing.
Zeroing the Probe While In Use The meter and probe are initially zeroed before the meter is allowed to go into the measurement mode. If you determine that significant drift may have occurred, it is simple to fine tune the zero. See Checking for Zero Drift on page 82. To zero the probe while in use... 1. Shield the probe using one of the methods described in Shielding the Probe. 2. Press the Auto Zero key. The meter will correct for any probe drift in about eight seconds.
86 Operating the Meter
15 Advanced Settings Description The Settings menu is used to control several features of the Model 8718B that need to be accessed infrequently. The options available under the Settings menu are: • Check or set the meter’s internal clock (time/date). • Enter a value for temperature. This feature is used only when the probe is separated from the meter and operating at a different ambient temperature. • Clear the memory of logged data. • Set the function keys for right or left handed operation.
Setting the Clock To check and/or change the time and date... 1. Access the settings menu by following the procedure described in Accessing the Settings Menu. 2. Press 1 to select CLOCK. A new screen will appear that displays the time on the left side of the screen and the date on the right. The time is in 24 hour format, i.e. 13:30 equals 1:30 P.M. The date format is MM/DD/YY. T I ME I S DATE I S 1 3 : 4 2 0 2 / 2 7 / 9 8 2 4 H R - F O R M A T - MM / D D / Y Y SET SET F1 3.
4. Proceed to setting the date, if required. 5. Alternately, press the Esc key to return to the First Menu Screen. Press Esc again to return to the measurements screen. To set the date... 1. Press F3 (SET). The display will change to show six underscore lines where the new date must be entered. T I ME I S DATE I 1 3 : 4 2 _ _ / _ _ / 2 4 H R - F O R M A T - D D / MM / SA F1 F2 F3 S _ _ YY VE F4 2. Enter the new date in DD/MM/YY format using the numeric keypad.
correct for the temperature differential. The amount of error that can occur when the meter and probe are operating at different temperatures depends on the particular probe design as well as the temperature differential. The maximum error that can occur is about 1% per degree Centigrade for diode probes and about 0.1% per degree Centigrade for thermocouple probes. The change may either increase or decrease the meter reading from the true value, depending on the probe model.
7. Once the correct probe temperature is displayed on the screen, press F4 (SAVE). The meter will automatically return to the measurements screen. 8. Alternately, press F1 (AUTO) to return to the default auto correct mode. Clearing the Memory Note All data will be lost when the memory is cleared. If you determine that there is insufficient memory available to perform the desired logging task because much of the meter’s memory has been used, it will be necessary to empty the memory.
Function Key Position The position of the commands for the function keys (F1-F4), as described in this guide, is for right-hand operation. Conventionally, right-handed people hold the probe in their right hand and the meter in their left hand. The choice of function key location for the START and LOG commands is particularly important because it is often desirable to press these keys without looking at the meter. This situation occurs during spatial averaging, data logging, and time averaging.
3. Press F1 (OK) to continue with the same setting without change. The meter will return to the First Menu Screen. Press Esc to return to the measurements screen. 4. Press F4 (LEFT) or F4 (RGT) to change to the alternate setting for function key menu position. The meter will return to the first menu screen. Press Esc to return to the measurements screen. Adjusting the Display Contrast The LCD display is set at the factory for the best contrast under typical conditions.
4. Press F4 (SET) to change the display contrast setting. The screen will change to show both the current setting and display an underscore where the new setting is entered. D I S P L A Y CON T RA S T OL D SE T T I NG : 6 N EW S E T T I NG : _ SAVE F1 94 F2 F3 F4 5. Use the numeric keypad to enter a single digit from 0-9 with 0 for the lightest setting and 9 the darkest setting. The contrast will change as soon as the numeric value is entered.
16 Operation with a Fiber Optic Link Description Narda fiber optic link transmitters are compatible with all 8700 series probes and the Model 8718B meter. The meter has a built-in fiber optic receiver compatible with the HP Versatile Link type plastic cables and connectors. The fiber optic transmitter connects directly or via a short cable to the probe. A fiber optic cable connects the 8718B to the transmitter.
The fiber optic link system also allows the meter and probe to be separated by up to 50 meters. One application is surveying towers. A skilled climber carries the probe while the person actually making the measurements remains on the ground.
To set the meter to use the fiber optic receiver input... 1. Access the menu system by pressing the function key that corresponds to the legend below MENU on the bottom line of the display. 2. Press 8 (NEXT) to select the Second Menu Screen. 3. Press 3 to select CABLE/FO. A new screen will appear that shows the current input status. PROB E F I BER OK F1 I NPUT CABLE : OPT I C : F2 STATUS ON OFF FO F3 F4 4. Press F1 (OK) to continue with the same input without change.
8. Press F4 (CABLE) to change to the cable input. The meter will return to the First Menu Screen. Press Esc to return to the measurements screen. System Checks To insure that the entire system – meter, fiber optic transmitter, and probe – are functioning properly... 98 1. Set the 8718B to use the fiber optic receiver input as previously described. 2. Connect the probe to the fiber optic transmitter. 3. Connect a fiber optic cable between the meter and the fiber optic transmitter. 4.
17 Operation with a Data Recorder Description The Model 8718B provides an output signal that can be connected to a data recorder to provide a continuous record of measurement over an extended period of time. The recorder output is available via the smaller of the two jacks located on the left side of the meter. The output is always on. Output Level The recorder output ranges from 0.0 volts to 3.0 volts. The level corresponds directly with the indication on the bar graph of the display.
Note The recorder output can be set to one of three fixed ranges by changing the bar graph range setting. See Bar Graph Ranges on page 23. Field Strength Recorder Voltage Bar Graph 0.01 mW/cm2 0.03 volts 1 % of Full Scale 0.50 mW/cm2 1.50 volts Half Scale 1.00 mW/cm 2 3.00 volts Full Scale 1.01 mW/cm 2 0.03 volts 1% of Full Scale 2 1.50 volts Half Scale 10.0 mW/cm 2 3.00 volts Full Scale 10.1 mW/cm 2 0.03 volts 1% of Full Scale 50 mW/cm2 1.50 volts Half Scale 100 mW/cm2 3.
18 User’s Software Description The 8718B User’s Software is a Windows™ - based program that performs three basic functions: • Probe Calibration Data. The User's Software is used to enter probe calibration information into the memory of the Model 8718B. • Data Retrieval. The User’s Software is used to download data collected with the Model 8718B with one of its three data logging modes. • Diagnostics and Upgrades.
Installing the User’s Software To set up the program... 1. Turn on the computer and start Microsoft Windows (type WIN) at the DOS prompt if your computer doesn’t start Windows automatically). 2. Insert the User’s Software into your CD-ROM drive. The CD starts automatically and the 8718B-menu screen appears. 3. Follow the instructions that appear on your screen. The setup program places all of the program files in a directory on your hard drive called 8718B.
Main Menu Screen Chapter 18 User's Software 103
Note The cable must be a RS232 serial cable with a DB9 male connector on one end and a DB9 female connector on the other end. Do NOT use a null modem cable since these are wired differently. Note that certain older model computers have a 25-pin connector for a serial port that will require either an adapter or a different cable. Note Operation of an older model 8718 meter that has been upgraded to Version 3.0 firmware is different.
You can have a maximum of six probes installed at any time. Since the serial number of the probe is identified as well as the model number, more than one probe of the same model number may be installed at the same time. To view or change probe calibration data in the meter’s internal memory... 1. Establish communications between the meter and your computer as described in paragraph in Establishing Communications... 2. Select Install Probes from the Install Probes menu.
Installing a Probe Note Probe Models 8782D and 8782 are unique low frequency electric field probes that feature a range switch on the probe to cover a total of 60 dB. The 8782 series probes must be entered as two separate probes since there are two different full-scale measurement ranges (dependent on the switch on the probe that the meter cannot control or know the status of) and each range has different calibration factors. Note A correction factor greater than 2.0 or less than 0.
Probe Installation Screen Chapter 18 User's Software 107
7. Enter any special calibration frequencies on the extra lines provided and enter the appropriate calibration factors. Delete any standard calibration frequencies that were not used. 8. Click on the Install Probe button. A dialog box will appear asking you if you are sure you want to install the probe. 9. Click on OK. The program will automatically send the calibration information to the meter via the modem and cable.
Downloading Logged Data from the Meter To download data from the meter... 1. Establish communications between the meter and your computer described in Establishing Communications.... 2. Select Download New Survey from the Survey Data menu. A dialog box will appear that reminds you to make sure that the 8718B is in a menu and not in a measurement mode.. 3. Click OK. 4. The message Downloading, please wait… will flash on the computer screen. 5.
Three sample files were loaded on your hard drive when installed the User’s Software. There is a sample for each of the three modes of data logging. Selecting a File to View To view stored surveys on your computer... 1. Select View Stored Surveys from the Survey Data menu. A dialog box will appear titled Open Survey File. Normal downloaded survey files stored on the computer’s hard drive will be listed in the table on the left. Downloaded survey files are stored in a subdirectory labeled Svy.
Logged Survey Data Screen Chapter 18 User's Software 111
d) The fourth line shows the Run Ref. Number that was entered by the user at the beginning of the survey, the Record number and total number of records in the file and the Date and Start Time when the first data point was taken. 2. The lower section of the window shows the measured data in both tabular and graphical form. a) The table on the left side of the screen displays up to eighteen (18) data points at one time.
f) The up and down keys to the right of Increment or Decrement By are used to determine how many records you advance or go back every time you click on the Prev. (previous) Record and Next Record buttons. The small window to the right of the arrows indicates the current setting. To view another survey file... 1. Select Load Survey File from the File menu to close the current logged data window and view another logged data file. A dialog box will appear titled Open Survey File.
Exporting Data To export a logged data file for use in a spreadsheet program... 1. Select Make Spreadsheet (.csv) File from the Export menu. A dialog box will appear titled Make Spreadsheet (.csv) File. The file selected to be exported drive will be listed in the table on the left. The default directory for exported survey files is Ssdata, which is a subdirectory under 8718B. You can select any drive and directory to export your file from this dialog box. 2.
Data menu. A dialog box will appear titled Restore Survey Data. It will ask to confirm that you want to clear the survey data from the meter’s memory. 4. Click OK to restore the last survey data to the meter’s memory. To clear the meter’s memory of logged data using the meter’s menu system... 1. Select 2 (SETTINGS) from the Second Menu Screen. 2. Press 3 (CLEAR MEMORY). A screen will appear requesting that you confirm your request and warning that the stored information will be lost. 3.
To update the meter’s firmware … Note Download any data that you want to save prior to upgrading the firmware. All stored data will be lost during the update process. Note Do not interrupt the update process. If the process is interrupted the firmware file may become corrupted. The meter will be inoperative and will have to be returned to Narda for repair. 1. Turn your meter on. Observe the firmware version number, which is displayed briefly about three seconds after you turn the meter on.
A Communications with a Computer Application The Model 8718B can be connected to a computer for real time transmission of data via the meter’s RS232 connector. A limited number of the meter’s functions can also be controlled remotely via the RS232 bus. Checksum and Modulo Description Modulo 256 is the remainder of any number X divided by 256. As an example, if the checksum is 1234, Modulo 256 of 1234 is 210.
Command Characters Function >A000CSCR AUTO ZERO >C000CSCR READ CLOCK (TIME DATE) >Dr00CSCR Display averaging change r=1, 2, 3, 4 low to high display averaging >E003XXXCSCR SET CF (Correction Factor) >F0r4XXXXCSCR SET FREQ X is DATA, r is kHz, MHz, GHz r=0=kHz, r=1=MHz, r=2=GHz >H000CSCR SEND HEADER (24 bytes of data) >P000CSCR DUMP PROBE DATA (432 bytes of data) >L000CSCR DUMP LOG DATA >V000CSCR READ displayed VALUE Last displayed value (6 bytes) + units (6 bytes) >X000CSCR READ MAX Co
Command Characters Function II To Change or initiate the following: SEND RESPONSE A) Auto Zero >A000CSCR ASCII >A000D1CR Hex 3E 41 30 30 30 44 31 0D ACR ACR 41 0D B) Read Clock >C000CSCR ASCII >C000D3CR Hex 3E 43 30 30 30 44 33 0D SMHXDNYCSCR (Where: S= seconds in BCD format M= minutes in BCD format H= hours in BCD format X= N/A D= day of month in BCD format N= month in BCD format Y= year (00-99) in BCD format CS= two byte checksum CR= carriage return ) C) D) Correction Factor >E003xxxCSCR Examp
Command Characters Function SEND G) Read Max >X000CSCR ASCII >X000E8CR Hex 3E 58 30 30 30 45 38 0D xxxxxxCSCR (6 data characters returned exactly as displayed) H) Reset Max >Y000CSCR ASCII >Y000E9CR Hex 3E 59 30 30 30 45 39 0D ACR I) 120 RESPONSE Display Averaging >Dr00CSCR ACR r=l for minimum to 4 for maximum display averaging Example: to set minimum display averaging (4:1) ASCII >D100D5CR Hex 3E 44 31 30 30 44 35 0D J) Read Calibrated Probe Data >P000CSCR ASCII >P000EOCR Hex 3E 50 30 30 30 45
B Theory of Operation Overall Functional Description The meter is a portable, battery-operated instrument that forms a complete RF Radiation Survey System when used with an interconnected Narda 8700 Series probe. Optionally, the system may employ a fiber optic transmitter and cable between the probe and meter. The survey system is designed to detect electromagnetic fields and to display the field level on the meter’s Liquid Crystal Display (LCD).
The meter also contains built-in self-testing facilities for checking the condition of the batteries, the operation of the probe and for zero adjustment of the probe. The meter provides a means for automatically zero adjusting the meter and probe. When in an operating mode and the probe is in a zero field, the operator presses the Auto Zero key to begin the auto zeroing routine. The 8718B meter uses a unique digital method to set the zero reference.
Appendix B Theory of Operation 123 Model 8718B Functional Block Diagram
Calibration is performed using the RS-232 port, a voltage source and a computer. PCB A1 PCB A1 is the primary circuit board within the meter. The majority of the components are surface mount. It is located in a heavily shielded area beneath the keypad. Operating power from battery B1 is routed through Q3 and Q4 that form a momentary switch for the micro controller U5. U5 provides a control signal to the +5V, -5V and +2.5V power supplies made up of U12, U13 and U14.
LCD Display D1 The LCD is a self-contained display and meter circuit assembly. The display has four lines with twenty characters per line. Each character is a 5 x 7 dot matrix. The display is backlit for improved visibility under low light conditions. It connects directly to PCB A1. Keypad S1 The keypad has 22 keys. It is shielded in aluminum and connects directly to PCB A1. Battery B1 The battery pack is a custom package consisting of six individual NiCd cells. It has a rated output of 7.
Microwave Band Electric Field Probes The 872xD series probes operate from 300 MHz to >50 GHz. They contain resistive thermocouples distributed along the length of the dipole. The spacing prevents resonance over the operating frequency range of the probes. The dipole may be viewed as a group of series connected small resistive dipoles or as a very low Q resonant circuit. Element sensitivity decreases with frequency.
This provides for the independence of probe orientation relative to the polarization of the field. The instantaneous charge distribution on adjacent cold junction elements produces a potential difference across the thin-film resistive thermocouples and a resultant dissipation of energy in these films. As the frequency increases, the phase difference between the potentials developed in adjacent junctions also increases the open circuit voltage.
128 Appendices
C Maintenance General The Model 8718B requires very little maintenance. No operator adjustments are required. The electronic circuitry is contained in a very rugged aluminum housing. However, this housing is not watertight and should not be immersed in water. The LCD display and the case may be cleaned using a damp cloth. Do not use any type of detergent or solvent. Calibration The Model 8718B is calibrated before it is shipped. Narda recommends that the Model 8718B be calibrated every two years.
Description Model or Part Number Battery Charger, 115 volt 84156000 Battery Charger, 230 volt 84156001 Power Cord 89707000 to 89707008 Storage Case 32542703 Probe Extension Cable 87744-04 Electric Field Attenuator 8713B Computer Cable 87239000 User's Software 990125 User's Guide 42983600 Insulated Tripod/Handle 21797900 Optional Accessory Tripod Adapter 32595900 Optional Accessory Comments Supplied with 230 volt charger only, see table for outline CD ROM Battery Charger and Line
Rechargeable Battery Management Program The Model 8718B contains a rechargeable nickel-cadmium battery that must be recycled or disposed of in compliance with applicable federal, state, or local environmental regulations. Narda maintains a rechargeable battery management program in keeping with its highly proactive policy on environmental protection and conservation of natural resources. This service is available to our customers at no charge.
132 Appendices
INDEX Audio Alarm Alarm Description Controlling Alarm Function Fixed Alarm Variable Tone Alarm 4, 67 67 68 69 Back Light 75 Bar Graph 23 Battery Accuracy of Battery Status Indicator Battery Capacity Charger, description Charger, line cord options Checking Battery Status Rechargeable Management Program Clock Communications with Computer 77 76 3, 130 3, 131 76 131 88 117 Correction Factors 24 Data Logging Format for Logged Data Memory Capacity Mode 1 Logging Mode 2 Logging Mode 3 Logging Options 44
INDEX Probe Test Sources Testing the Probe 4 23 Probe Zero Causes of Zero Drift Checking for Zero Drift Establishing a Zero Field Shielding the Probe Temperature Concerns Understanding the Zero Function Zeroing the Probe, in use Zeroing the Probe, initial 82 82 83 84 83 81 85 17 Spatially-Averaged Measurements Spatial Averaging with the 8718B Understanding Spatial Averaging 40 39 Standards Feature 71 Time-Averaged Measurements Making Time-Averaged Measurements Measurement Options Mode 1 Averaging Mo
Warranty Narda Safety Test Solutions (Narda STS) warrants each product of its manufacture to be free from any defect in material and workmanship for a period of one year from date of shipment to, and return by, the original purchaser. All warranty returns, however, must first be authorized by a factory office representative. The limit of liability under this warranty shall be to repair or replace any product, or part thereof, which proves to be defective after inspection by Narda STS.
USA: 435 Moreland Road Hauppauge, NY 11788 Tel 1-631 231-1700 Fax 1-631 231-1711 E-Mail NardaSTS@L-3COM.com www.narda-sts.com GERMANY: Sandwiesenstrasse 7 D-72793 Pfullingen Tel +49-7121-9732-777 Fax +49-7121-9732-790 E-Mail support@narda-sts.de www.narda-sts.