
User's Manual

Chapter 5 Getting Started with Measurement Studio
© National Instruments Corporation 5-11 Measurement Studio User Manual
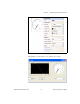
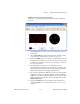
15. Select Debug»Start Without Debugging to run the application.
16. After your program builds, click Start. Notice the graph shows the
data plot, and the gauge and the numeric edit display the mean of
the data.
Walkthrough: Creating a Measurement Studio
Application with Web Forms Controls and Analysis
Note To complete this walkthrough, you must have either the Measurement Studio
Professional or Measurement Studio Enterprise package installed for Visual Studio 2005
or later. This walkthrough will not work with the Measurement Studio Standard package.
Measurement Studio includes user interface controls, such as a waveform
graph control and a gauge control, and Analysis functionality, such as
signal generation and mathematical functions. This walkthrough is
designed to help you learn how to add analysis and presentation
functionality to a Web Forms application by taking you through the
following steps:
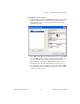
• Setting up the project—Using the Measurement Studio Application
Wizard, you will create a new project that references the Measurement
Studio Analysis class library and Web Forms controls.
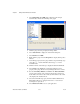
• Adding user interface controls to the project—Using the Toolbox
and the Properties window, you will add and configure a button,
waveform graph, legend, gauge, and numeric edit user interface
control.