
Bridge User Manual


Chapter 10 Customizing VIs
BridgeVIEW User Manual 10-6 © National Instruments Corporation
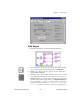
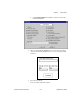
Front Panel
10. Open a new front panel.
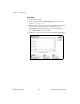
11. Place a Waveform Chart (Controls»Graph) on the front panel and
label it
Temperature Data
.
12. Modify the scale of the chart, so that its upper limit is set to 90.0 and
its lower limit is set to 70.0. Pop up on the chart and choose
Show»Legend to hide the legend. Pop up on the chart again and
choose Show»Palette to hide the palette.
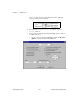
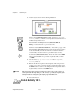
13. Build the rest of the front panel as shown in the following illustration.